From time to time, you may experience some kind of issue in your BPM environment. Issues could be caused by a wide variety of reasons – changes to the environment, the pattern of load on the environment, product defects, bad process design, insufficient resources allocated to the environment, network instability – just to name a few!
When something goes wrong, it is important to know how to collect the diagnostic information that will be needed to analyse the problem, work out the root cause, and come up with a resolution. In some cases, you may be able to do this analysis yourself. In other cases you may need to involve specialists like network engineers, directory administrators, or Oracle Support, for example.
Let’s take a look at the kinds of diagnostic information that may be needed. Of course, it may not be necessary to collect all of these for any given issue. If you are unsure, then it is a good idea to collect them anyway, just in case you need them.
Note: The purpose of this article is to tell you how to collect the data, not how to analyse it. Sometimes that analysis requires specialist skills and experience, but even then, those specialists rely on having access to the data.
BPM server/cluster configuration files
The first thing that you will want to collect is the configuration files for your environment. There are many different types of configurations that are possible, and these files contain the information necessary for someone to understand exactly how your particular environment is configured.
These files are located inside your WebLogic domain’s home directory, in the config directory. You will see files and directories like this:
config
|-- config.xml
|-- configCache
|-- deployments
|-- diagnostics
|-- fmwconfig
|-- jdbc
|-- jms
|-- nodemanager
|-- security
`-- startup
You can just zip up this whole directory to collect the files. You might use a command like this for example:
tar xzvf bpm_config.tar.gz /home/oracle/fmwhome/user_projects/domains/base_domain/config
Note: All of the examples in this post show the Oracle Middleware home as /home/oracle/fmwhome and the WebLogic domain name as base_domain. You will need to adjust these to suit your own environment.
The next useful piece of information to capture is a list of which patches (if any) you have installed in your environment. The best way to collect this information is to capture the output of the opatch lsinventory command. You should run this twice, first with ORACLE_HOME set to the Oracle_SOA1 directory under your install directory, and second with it set to the oracle_common directory under your install directory.
The example below shows running the opatch lsinventory command for ORACLE_HOME=/home/oracle/fmwhome/Oracle_SOA1 and the output, which in this case shows that no patches have been installed. In this example, you would also run it again with ORACLE_HOME=/home/oracle/fmwhome/oracle_common.
[oracle@ps5 Oracle_SOA1]$ export ORACLE_HOME=/home/oracle/fmwhome/Oracle_SOA1
[oracle@ps5 Oracle_SOA1]$ export PATH=$ORACLE_HOME/OPatch:$PATH
[oracle@ps5 Oracle_SOA1]$ opatch lsinventory
Oracle Interim Patch Installer version 11.1.0.9.0
Copyright (c) 2011, Oracle Corporation.  All rights reserved.

Oracle Home       : /home/oracle/fmwhome/Oracle_SOA1
Central Inventory : /home/oracle/oraInventory
   from           : /home/oracle/fmwhome/Oracle_SOA1/oraInst.loc
OPatch version    : 11.1.0.9.0
OUI version       : 11.1.0.9.0
OUI location      : /home/oracle/fmwhome/Oracle_SOA1/oui
Log file location : /home/oracle/fmwhome/Oracle_SOA1/cfgtoollogs/opatch/opatch2012-12-20_11-18-33AM_1.log

Patch history file: /home/oracle/fmwhome/Oracle_SOA1/cfgtoollogs/opatch/opatch_history.txt

OPatch detects the Middleware Home as "/home/oracle/fmwhome"

Lsinventory Output file location : /home/oracle/fmwhome/Oracle_SOA1/cfgtoollogs/opatch/lsinv/lsinventory2012-12-20_11-18-33AM.txt

--------------------------------------------------------------------------------
Installed Top-level Products (1):

Oracle SOA Suite 11g                                                 11.1.1.6.0
There are 1 products installed in this Oracle Home.

There are no Interim patches installed in this Oracle Home.

--------------------------------------------------------------------------------

OPatch succeeded.
BPM log files
The information we have collected already is generic in nature and is used to ensure the domain configuration is correct and there are no obvious problems. From this point on, we are looking at information that is used to analyse a specific problem.
The server log and ‘out’ files are often the very first place we will look when there is a problem. These files will usually contain error messages that ,will give some information about the cause of the problem.
You can use a command like this to collect the logs. Remember to collect the logs from your AdminServer and each of your managed servers.
tar xzvf soa_server1_logs.tar.gz /home/oracle/fmwhome/user_projects/domains/base_domain/servers/soa_server1/logs
This will also collect the diagnostic_images if there are any available. These provide additional information about certain problems.
It is important to understand that a problem may occur only on one server, or on a number of servers. This is why it is important to collect the logs from all of the servers. Sometimes it is necessary to analyse data from several sources in order to understand what was happening in the environment.
Sometimes, during the analysis of a problem, you may be asked to turn on some debug/trace settings and attempt to recreate the problem. If this happens, the output from those traces almost always end up in these logs.
Incident logs
WebLogic collects some data by default when various ‘incidents’ occur, for example when a ‘stuck thread’ is encountered. The data collected depends on the incident, but it usually contains things like thread dumps, logs, and error messages.
These data are stored inside the server directories in your domain directory. To collect them, you could use a command like the example below. Remember to collect the incident logs for you AdminServer and each of your managed servers.
tar xzvf incident_logs.tar.gz /home/oracle/fmwhome/user_projects/domains/base_domain/servers/soa_server1/adr/diag/ofm/base_domain/soa_server1/incident
Thread dumps
A thread dump is a snapshot of what is happening in the server at a particular point in time. It allows us to see what each thread in the server process is doing. This information is helpful to understand how the server is behaving and what it is doing.
You can take a thread dump in a variety of ways, and how you do it depends on your operating system, how you started the server, e.g. whether you started it from a command line or the node manager, and if the server has become unresponsive.
Here are some of the common ways to take a thread dump:
- Pressing Ctrl-Break on Windows, or Ctrl-\ on Linux/Solaris/etc. in the window running the WebLogic process (in the foreground),
- Sending signal 3 (SIGQUIT) to the process (kill -3 PID),
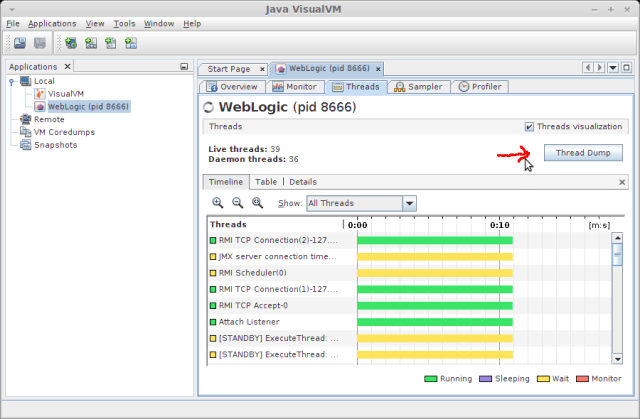
- Connecting to the process with a utility like jvisualvm and pressing the Thread Dump button:
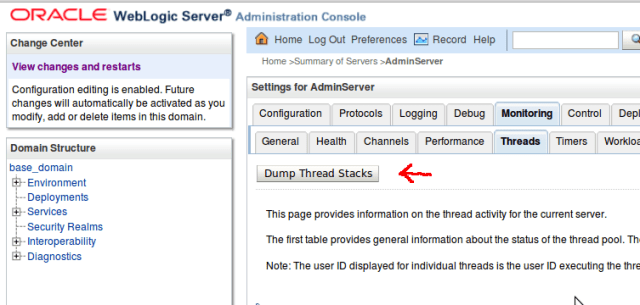
- Requesting a thread dump in the WebLogic Server console by navigating to the server, then the Monitoring tab and the Threads sub-tab and pressing the Dump Thread Stacks button:
- Use jstack PID (or jrcmd PID print_threads for JRockit).
Most of the time, more than one thread dump will be required. A series of thread dumps over some time period are needed in order to understand how the server is behaving over time. For example, a thread dump might show that a particular thread is ‘stuck’. Another (later) thread dump will be needed to see if that thread becomes unstuck by itself later on (as commonly happens) or not. Thus the two thread dumps together would be necessary to determine if the stuck thread was a problem or not.
It is also important to take thread dumps on all of the servers that are (or could possibly be) affected by or contributing to the problem. If in doubt, take thread dumps on all of the servers.
As a general rule of thumb, you should take five thread dumps over a period of time. How do you work out a suitable period of time? If you have a specific problem, for example you see some error message and then a minute later all of your servers become unresponsive, then the time period is that minute. Take a thread dump when you first see the error message appear, then one every 20 seconds (or so). If you don’t have any way to guess the suitable time period, just take them a minute apart.
The example below shows what the output from the thread dump looks like. Note that many lines have been removed from this output.
2012-12-31 10:26:12
Full thread dump Java HotSpot(TM) 64-Bit Server VM (20.10-b01 mixed mode):

"JMX server connection timeout 48" daemon prio=10 tid=0x00007fabf8006800 nid=0x232f in Object.wait() [0x00007fac330b4000]
   java.lang.Thread.State: TIMED_WAITING (on object monitor)
	at java.lang.Object.wait(Native Method)
	- waiting on <0x00000000f61ad8c0> (a [I)
	at com.sun.jmx.remote.internal.ServerCommunicatorAdmin$Timeout.run(ServerCommunicatorAdmin.java:150)
	- locked <0x00000000f61ad8c0> (a [I)
	at java.lang.Thread.run(Thread.java:662)

(many lines deleted)

"main" prio=10 tid=0x00007facc4008800 nid=0x21db in Object.wait() [0x00007facc9f38000]
   java.lang.Thread.State: WAITING (on object monitor)
	at java.lang.Object.wait(Native Method)
	- waiting on <0x00000000e0bb22a0> (a weblogic.t3.srvr.T3Srvr)
	at java.lang.Object.wait(Object.java:485)
	at weblogic.t3.srvr.T3Srvr.waitForDeath(T3Srvr.java:981)
	- locked <0x00000000e0bb22a0> (a weblogic.t3.srvr.T3Srvr)
	at weblogic.t3.srvr.T3Srvr.run(T3Srvr.java:490)
	at weblogic.Server.main(Server.java:71)

"VM Thread" prio=10 tid=0x00007facc406e000 nid=0x21e4 runnable

"GC task thread#0 (ParallelGC)" prio=10 tid=0x00007facc401b800 nid=0x21dc runnable

"GC task thread#1 (ParallelGC)" prio=10 tid=0x00007facc401d800 nid=0x21dd runnable

"VM Periodic Task Thread" prio=10 tid=0x00007facc40ad000 nid=0x21eb waiting on condition

JNI global references: 1601

Heap
 PSYoungGen      total 111744K, used 71412K [0x00000000f5560000, 0x00000000fdaa0000, 0x0000000100000000)
  eden space 89856K, 76% used [0x00000000f5560000,0x00000000f985f160,0x00000000fad20000)
  from space 21888K, 12% used [0x00000000fc540000,0x00000000fc7fe198,0x00000000fdaa0000)
  to   space 23296K, 0% used [0x00000000fad20000,0x00000000fad20000,0x00000000fc3e0000)
 PSOldGen        total 174784K, used 65947K [0x00000000e0000000, 0x00000000eaab0000, 0x00000000f5560000)
  object space 174784K, 37% used [0x00000000e0000000,0x00000000e4066c60,0x00000000eaab0000)
 PSPermGen       total 131072K, used 125060K [0x00000000d0000000, 0x00000000d8000000, 0x00000000e0000000)
  object space 131072K, 95% used [0x00000000d0000000,0x00000000d7a211b8,0x00000000d8000000)
Heap dumps
Another kind of dump that may be required for some problems is a heap dump. A heap dump is essentially a copy of everything that the JVM has in memory (in the heap) at a particular point in time. These are usually going to be pretty big files – they will be at least as big as the amount of used heap. So if you are running your BPM managed server with an 8GB heap, and it is 75% in use when you take the heap dump, then the heap dump is going to be about 6GB in size.
Heap dumps are used to look at the contents of the JVM’s memory in detail. They allow us to look at every object in the JVM and see the state of those objects.
Heap dumps are often used to diagnose a class of problems called ‘memory leaks’. While a single heap dump can lead us to suspect a memory leak, two heap dumps (from the same JVM at different times) are needed to confirm that a memory leak actually exists.
Heap dumps are also useful for other kinds of problems, where we need to look at the contents of various objects to understand what the server is doing.
It is a good practice to collect heap dumps when problems occur, but you should not send them to Oracle unless they are requested. Since they are so large, you may also wish to compress them and delete them after the problem they relate to has been resolved.
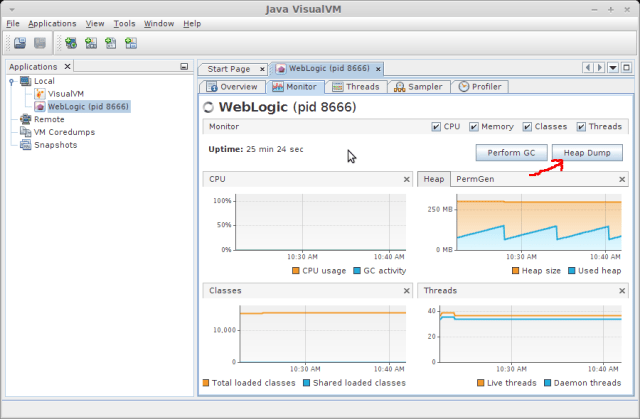
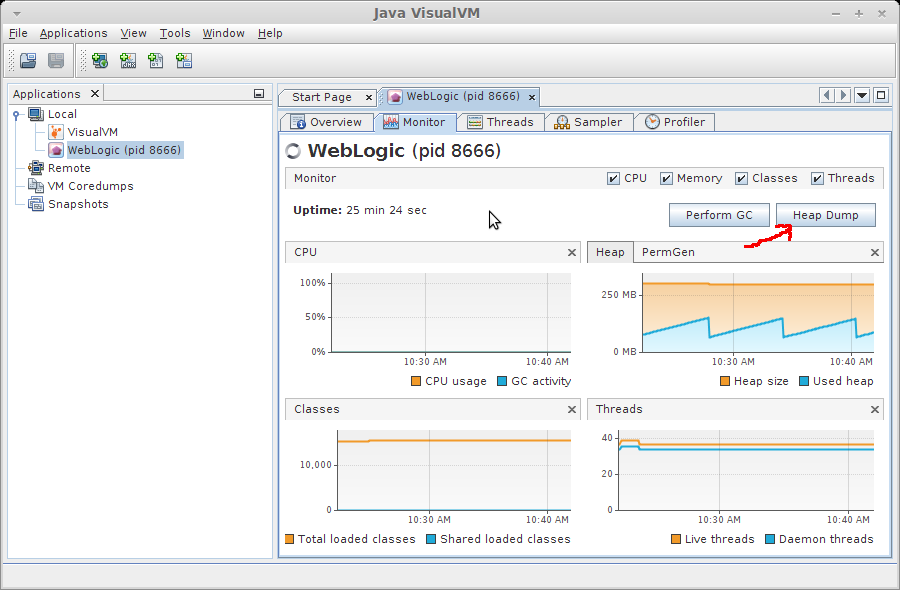
You can generate a heap dump from a tool like jvisualvm (by pressing the Heap Dump button) as shown below:
You can also collect a heap dump using jmap using a command like the one below:
jmap -dump:format=b,file=heap_dump_1.bin pid
If the problem is suspected to be a memory leak, you may be asked to carry out the following steps:
- allow the server to come to a steady state after startup,
- perform six full garbage collections (by pressing the Perform GC button, next to the Heap Dump button, six times),
- take a heap dump,
- attempt to reproduce the issue, i.e. do whatever it is you do to make the problem occur,
- take another heap dump.
Another good practice is to ensure that you have configured WebLogic to automatically take a heap dump if it runs out of memory. This is done by adding the following parameter to the JVM:
-XX:+HeapDumpOnOutOfMemoryError
This setting often saves a lot of pain – if your server crashes because it ran out of memory, then this setting is pretty likely to capture the information needed to work out what went wrong. If you do not have this setting, you would need to add it, and wait for the problem to happen again. It is safe to have this setting on all of your production servers. Note that it takes some time to take a heap dump (how long depends on the size of the heap and the speed of your disks) so there is a trade-off here – collecting the information needed to fix the problem will mean that your server restart will take a bit longer, as you will have to wait for the heap dump to finish before you restart the server(s).
Garbage Collection logs
Garbage collection logs are very useful for analysing memory related issues. The JVM will not produce these logs by default, you need to tell it to produce them.
These three settings will cause the JVM to print out more detailed information about garbage collection and to produce a log (called gc.log in this example) that contains garbage collection statistics and information that is very useful when trying to do some JVM tuning:
    -XX:+PrintGCTimeStamps
    -XX:+PrintGCDetails
    -Xloggc:gc.log
And, as mentioned in the previous section, it is also a good idea to turn on this setting:
-XX:+HeapDumpOnOutOfMemoryError
These settings are safe to leave on all the time in your production environment.
Database information – AWR reports
Many performance related issues may have to do with the underlying database. For this reason, it is important to capture some information about the database performance as well. You should collect the AWR reports for the same period during which you observed the problem in BPM. To be on the safe side, start a little earlier and end a little later. For example, if the problem occurred from 10am until noon, you might collect AWR reports from 9am to 1pm.
You can find more information about what AWR reports are and how to collect them in this post.
HTTP Server logs
For some kinds of problems, it is useful to see the logs from the HTTP Server (if any) which is in front of your BPM server or cluster. These are often useful if you are getting refused connections for example.
You should gather the following logs:
  access.log
  error.log
If you are using Oracle Web Tier (or Oracle HTTP Server), these logs will be located in the following directory, assuming your Oracle Web Tier Home is /home/oracle/httphome and you used the default names for the instance:
/home/oracle/httphome/Oracle_WT1/instances/instance1/diagnostics/logs/OHS/ohs1
Debug logs for the WebLogic plugin may also be useful if you are seeing nodes being evicted from the cluster or if you suspect that the cluster is unbalanced – e.g. you can see a different number of sessions on each node in the cluster.
To obtain these, you need to set DEBUG=ALL in the httpd-vhosts.conf file. This will produce a log called wlproxy.log.
Operating system level information
Sometimes performance information from the operating system level can be helpful as well. You might want to consider using tools like top or prstat (with thread/’lightweight process’ support), sar, vmstat, mpstat, iostat, and netstat. If you are have a possibly network-related issue, for example loss of communications between cluster members, then tcpdump may also capture useful information.
Remember, if you are running a cluster, you would need to collect these on all nodes in the cluster at the same time.
Java information
There are also several Java tools that can help you to collect additional information. If you are not familiar with these, it might be a good idea to explore what they can do for you. I would suggest looking at jps, jstat, jinfo, jstack, jmap, and jtop.
How to send information to Oracle Support
If you need help with the problem, you should contact Oracle Support and open a Service Request (SR). The Oracle Support system will allow you to upload attachments to the SR so that you can provide information you have collected. If the files are large, like a heap dump for example, then you should upload them to Oracle Support’s FTP server instead. Support will give you instructions on how to access the ftp server and where to put your files.


You must be logged in to post a comment.