
Freshness note: At the time of writing, the current exporter release is 2.3.1, the default listen address is :9161, the default telemetry path is /metrics, and container examples use container-registry.oracle.com/database/observability-exporter:2.3.1. Treat these as version-specific details and recheck current documentation before relying on copy/paste commands.
Application telemetry stops too early
A Spring Boot AI service can look healthy in the places developers check first. The HTTP layer reports normal error rates. Application metrics show request latency, JVM behavior, token timing, and maybe HikariCP connection pool usage. Then a retrieval-augmented generation, or RAG, endpoint slows down, and the only obvious clue is that “the database call took longer.”
That clue is too thin when Oracle Database is part of the user experience. The database may hold vectors, JSON documents, relational records, queues, conversation state, ingestion metadata, and application state. A slow answer might come from a code change in the service, a different retrieval query, an ingestion job competing with search traffic, a session spike, a wait-class shift, or a SQL hotspot.
Application telemetry is necessary, but it often stops at the application boundary. Database-side metrics fill a different gap: they show what the database was doing during the same time window as application latency, pool pressure, model calls, deployments, and workload changes.
Oracle Database Metrics Exporter exposes Oracle Database metrics so observability tools can scrape, store, visualize, and alert on database behavior alongside application behavior. The payoff is not another dashboard for its own sake. The payoff is correlation by workflow: when a RAG endpoint slows down, developers and platform teams can inspect database-side signals in the same timeline as the service that depends on them.
What a database exporter does
A database exporter is a small service that connects to a database, collects selected metrics, and exposes those metrics through an endpoint that monitoring systems can scrape.
That definition matters because an exporter is a bridge, not the destination. It is not the database. It is not Grafana. It is not an application metrics library. It is not a trace collector. Its job is to turn database-side signals into input for the observability pipeline you already use.
In a Prometheus-style setup, the monitoring system usually follows a pull model. Prometheus or another compatible scraper periodically requests metrics from a target endpoint. The exporter is that target. It connects to Oracle Database, collects configured metrics, and exposes them over HTTP in a scrapeable format.
That changes the debugging conversation. Instead of asking for a separate database view after the fact, the application team can start with a shared timeline: request latency rose at 10:05, connection pool wait time rose at 10:06, sessions increased at 10:06, and database wait behavior changed at 10:07. Metrics do not finish the diagnosis, but they tell everyone where to look next.
What Oracle Database Metrics Exporter is
Tthe exporter is a bridge between Oracle Database instances and observability tools. The exporter exposes metrics in a format compatible with Prometheus-style scraping. metrics are OpenTelemetry and Prometheus-compatible. This article focuses on the Prometheus path because it is the most direct path to reason about: the exporter exposes metrics over HTTP, Prometheus or a compatible scraper collects and stores them, and Grafana visualizes them through a Prometheus-compatible data source.
In an OpenTelemetry-oriented platform, a common pattern is to use the OpenTelemetry Collector as part of the metrics pipeline, for example by scraping the exporter’s Prometheus-format endpoint with the Collector’s Prometheus receiver and forwarding metrics to a backend. That does not mean the exporter emits traces, performs automatic application-to-database trace correlation, or natively pushes OTLP metrics to every backend.
The exporter project is free and open source. It is available under your choice of the Universal Permissive License v1.0, or the MIT license . That statement applies to the exporter project itself; database, infrastructure, cloud service, managed backend, and SaaS observability costs are separate.
The exporter works across on-premises, cloud, Kubernetes, single-instance, clustered, and Autonomous Database deployments. Check the current docs for exact version, network, authentication, wallet, and privilege requirements in your environment.
The exporter can provide default metrics and custom SQL-based metrics defined in YAML or TOML. Custom metrics are powerful, but they need design review. Each query needs appropriate database grants and should be evaluated for execution cost, scrape interval, timeout behavior, label cardinality, and sensitive data exposure.
The path from Oracle Database to Grafana
Grafana is not collecting from Oracle Database directly in this path. The usual flow looks like this:

The default endpoint details are version-specific. In version 2.3.1, the exporter defaults to --web.listen-address=:9161 and --web.telemetry-path="/metrics".
The networking detail that trips up many first demos is point of view. Use the address reachable from Prometheus, not necessarily the address reachable from your terminal. For a same-host local test, this might be localhost:9161. In Docker Compose, localhost usually means the Prometheus container itself, so the target is usually the exporter service name. In Kubernetes, it would normally be a Service DNS name.
For a same-host local test where Prometheus can reach the exporter on localhost, the scrape target might look like this:
scrape_configs: - job_name: "oracle-database" static_configs: - targets: ["localhost:9161"]
For a Docker Compose-style setup where exporter is the service name reachable from the Prometheus container, the target would look more like this:
scrape_configs: - job_name: "oracle-database" static_configs: - targets: ["exporter:9161"]
These snippets show the shape of the scrape configuration, not a complete production Prometheus setup. The correct target depends on where Prometheus runs, how the exporter is exposed, and what network rules sit between the scraper and the exporter.
A first useful local check
The smallest useful demo is not a full dashboard. It is proving that the exporter can connect to a development database and expose one expected metric.
Oracle provides a local Docker Compose test stack with Oracle AI Database, the exporter, Prometheus, and Grafana, and the docs state that it provisions a dashboard. Treat that stack as local testing only. Do not expose sample database listener ports on shared or public hosts.
You can start up the demo system with a command like this – make sure you choose a password, don’t copy the example:
cd docker-composeDB_PASSWORD='<choose-a-local-demo-password>' docker-compose up -d
Once the exporter is running and reachable from your shell, the first check is simple:
curl http://localhost:9161/metrics | grep oracledb_up
Expected shape:
oracledb_up{database="..."} 1
This proves that the exporter can observe the database from its own connection path. It does not prove application health, production readiness, or that every metric query succeeded. If oracledb_up is missing or zero, check exporter logs, database connectivity, credentials, privileges, service name, and metric configuration before trusting deeper panels.
You can log into the Grafana instance at http://localhost:3000 and you will need to enter “admin” as both the user and the password. It will ask you to create a new password. Then you can nagivate to “Dashboards” and open the “Oracle Dashboard”. You’ll see something like this:
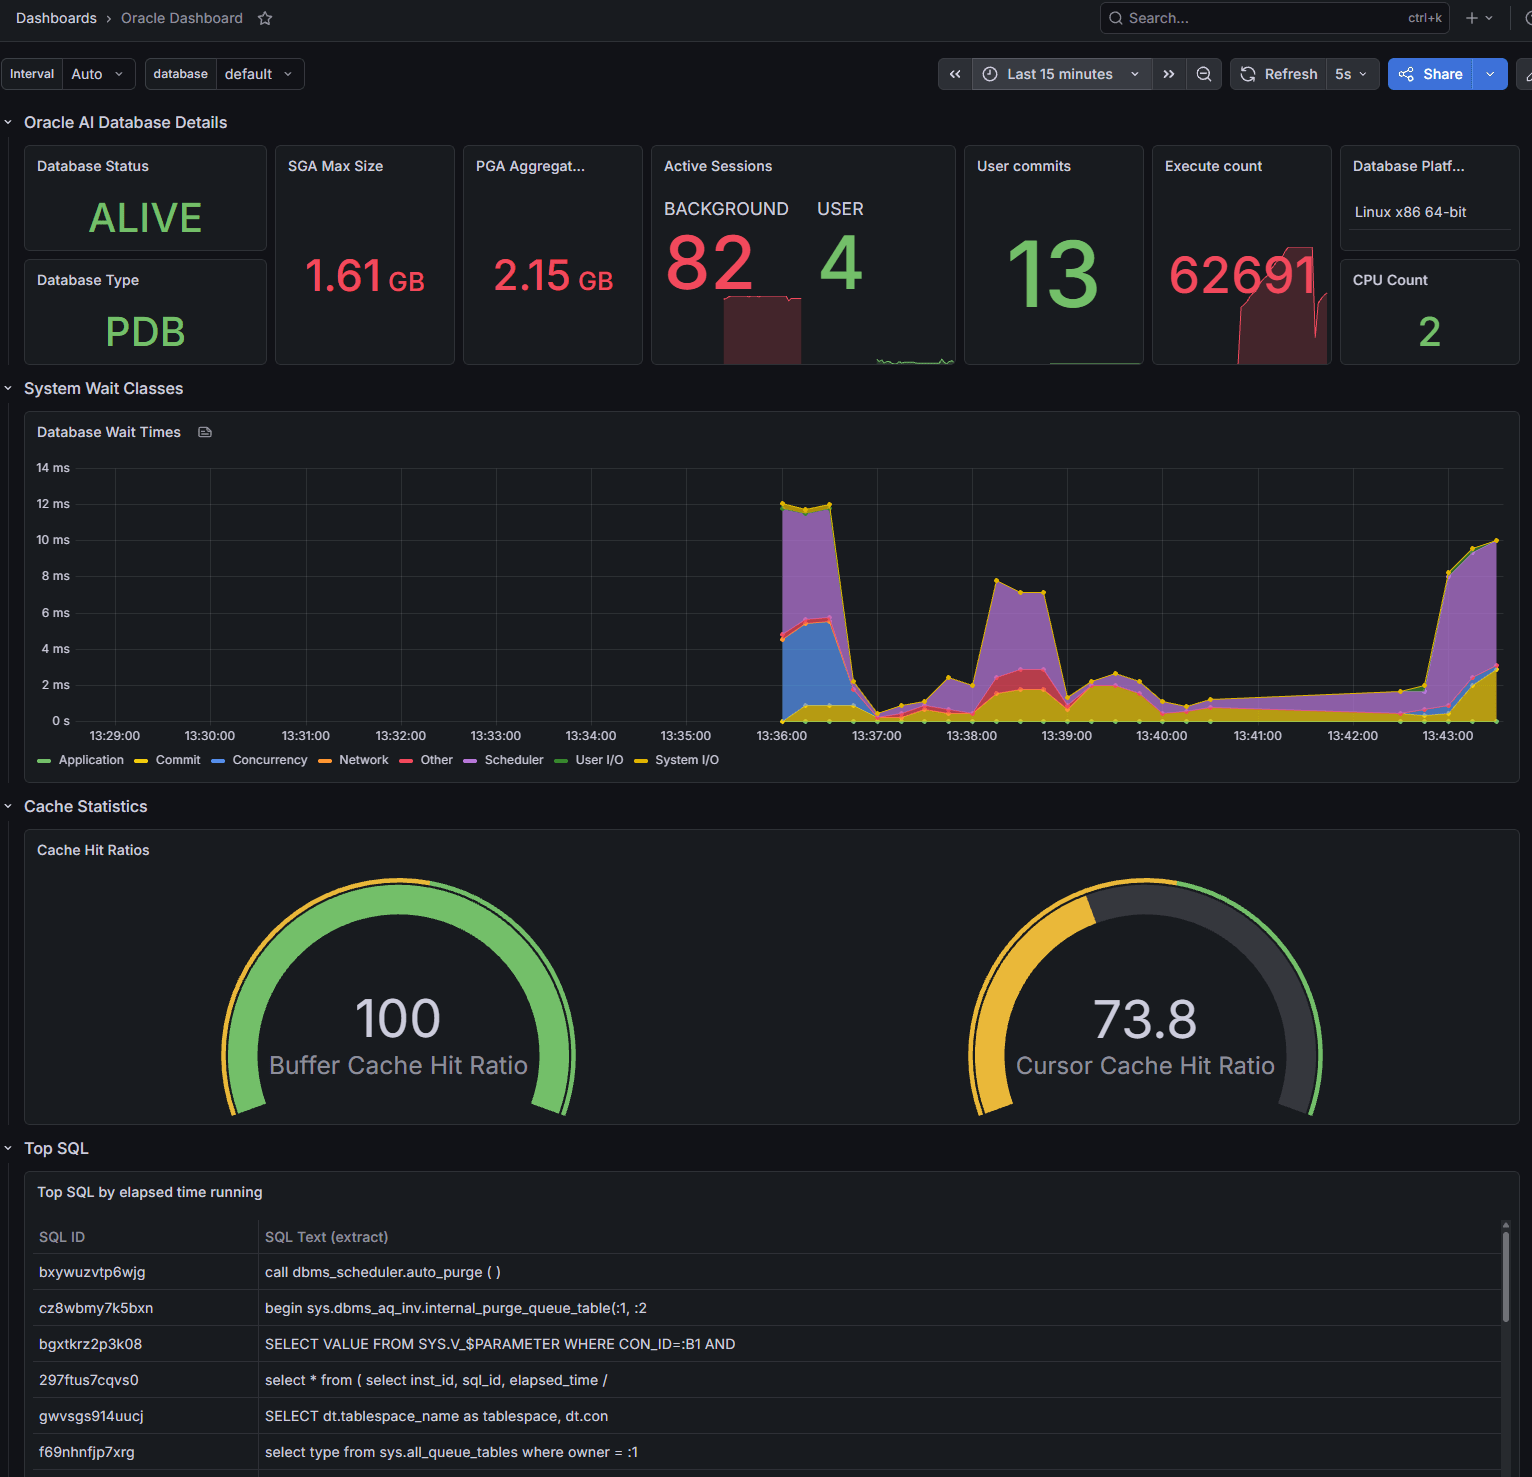
What to look at first
Start with exporter health before interpreting database behavior. The default metrics include oracledb_exporter_last_scrape_error, oracledb_exporter_last_scrape_duration_seconds, and oracledb_exporter_scrapes_total.
A healthy oracledb_exporter_last_scrape_error value is 0. A nonzero value indicates exporter scrape errors, not necessarily a database outage. The cause might be credentials, network reachability, a timeout, a permissions problem, a custom metric query, or database load.
Then add a few database-side panels that help explain application symptoms.
oracledb_up is the basic availability signal from the exporter’s perspective:
oracledb_up
For sessions, Oracle’s 2.3.1 sample output shows oracledb_sessions_value with labels such as status and type, so this is a reasonable first query after validating your own output:
sum by (status, type) (oracledb_sessions_value)
Do not treat this as a direct count of active users. Database background sessions and configuration can make the result noisy. The useful question is whether the shape changes during the incident window: did sessions rise when the endpoint slowed down, did inactive sessions pile up, or did work shift after a deployment or ingestion job?
Activity metrics such as oracledb_activity_execute_count, oracledb_activity_parse_count_total, oracledb_activity_user_commits, and oracledb_activity_user_rollbacks can show whether workload changed. Graph activity metrics directly first. Only use rate() after confirming the metric type and behavior in the exporter output for your version, because the docs expose some cumulative-looking database activity values as gauges.
Wait-time metrics provide another useful triage layer. Default metrics include categories such as user I/O, system I/O, concurrency, application, commit, and network:
oracledb_wait_time_user_iooracledb_wait_time_system_iooracledb_wait_time_concurrencyoracledb_wait_time_applicationoracledb_wait_time_commitoracledb_wait_time_network
In the demo environment, there is probably not enough workload to see waits. In a real system, the value is in watching whether wait behavior changes during the same window as application latency.
The default metrics also include oracledb_top_sql_elapsed. Use it as a hotspot signal, not as a complete tuning workflow. In the sample, this metric includes labels such as SQL ID and truncated SQL text. That can be useful for triage, but it also raises label-cardinality and sensitive-text concerns. Review whether those labels are appropriate for your monitoring backend before enabling broad retention or alerting on them. You may not want all your SQL statement being stored in your monitoring backend!
Why AI applications make database metrics part of user experience
AI applications often make database behavior more visible to users, even when the application code hides the details. A RAG endpoint might perform vector search, filter JSON metadata, fetch relational records, update conversation memory, write audit rows, and call a model in a single request path. If one of those database steps slows down, the user experiences it as a slow answer.
Application metrics can show that the endpoint got slower. They may also show that the connection pool waited longer or that model latency was stable. But they usually cannot answer database-side questions by themselves:
Did sessions rise during ingestion? Did execute or parse activity change after a new retrieval strategy? Did waits move toward I/O, concurrency, commit, network, or application categories? Did a new SQL shape become a hotspot? Did the exporter itself start reporting scrape errors?
Oracle Database Metrics Exporter helps answer those questions in the same observability workspace used for service metrics. That does not make the exporter an AI-specific tool. It makes it useful for AI systems because AI request paths often combine application code, database retrieval, background ingestion, and model calls in ways that are difficult to debug from one layer alone.
Security basics before copy/paste becomes habit
The exporter needs database connectivity and credentials. For demos, environment variables are acceptable placeholders. For production-like setups, use configuration files, password files, vault integrations, wallet-based authentication, or platform secret management as appropriate.
There are several credential and authentication options, including username/password, environment-variable substitution, password files, OCI Vault, Azure Vault, HashiCorp Vault, Oracle Wallet with TLS or mTLS, Secure External Password Store, and external authentication. For mTLS connections, including Autonomous Database with mTLS, Oracle Wallet is required.
Privileges deserve the same care. For default metrics, the documentation lists SELECT_CATALOG_ROLE as one option and also lists object-level grants on specific catalog and dynamic performance views. Do not treat SELECT_CATALOG_ROLE as automatically least privilege. In production-like environments, create a dedicated monitoring user and grant the narrowest permissions that support the metrics you actually collect. For custom metrics, grant access only to the objects queried by those metrics.
Tune scrape interval and query timeout for your environment. Metric collection is database work. Its cost depends on the default metrics you enable, custom SQL, scrape frequency, query timeout, number of databases, network latency, and current database load. You should be aware that running the exporter is not “zero overhead” or “low overhead” – it depends on the metrics you define and how often you collect them. You should perform measurement in your own environment.
Network placement also matters. The exporter must reach the database listener. Prometheus or the OpenTelemetry Collector must reach the exporter endpoint. Grafana must reach the metrics backend, not necessarily the exporter. In production, keep database listeners and exporter endpoints inside the intended network boundary and expose only what your monitoring architecture requires.
How it fits with tools you already have
Oracle Database Metrics Exporter complements application telemetry; it does not replace it. Spring Boot Actuator and Micrometer show how the application experiences the database: connection pool wait time, request latency, error rates, JVM behavior, and application-specific counters. The exporter shows database-side signals. The useful workflow is to compare both in the same time window.
It also does not replace Oracle Enterprise Manager or deeper Oracle diagnostic workflows. Enterprise Manager remains a broader Oracle management and monitoring platform. Exporter metrics are a different integration primitive: a bridge into Prometheus-compatible developer and SRE metrics workflows.
For detailed SQL tuning, plan changes, workload analysis, and deeper database diagnosis, use the appropriate Oracle diagnostic tooling and DBA workflows, subject to your edition and licensing. Metrics can tell you where to look. They do not automatically explain every query plan, locking issue, schema design problem, or workload pattern.
The exporter path is most relevant when Prometheus-compatible metrics are the standard integration layer, or when platform teams want Oracle Database behavior available in the same metrics pipeline as the rest of their services.
Custom SQL collectors can also be useful, especially for application-specific signals. The tradeoff is that you own the query design, metric naming, labels, metric types, privileges, scrape endpoint, and operational behavior. A maintained database exporter reduces the need to build every one of those pieces from scratch.
The practical mental model
Think of Oracle Database Metrics Exporter as a narrow but valuable bridge:
Oracle Database behavior → exporter metric queries → scrapeable metrics endpoint → Prometheus-compatible storage → Grafana panels, alerts, and shared incident timelines
That bridge is useful because database behavior often explains application symptoms. It is especially useful for AI applications, where one slow response may involve retrieval queries, JSON filters, vector search, ingestion load, connection pools, and model calls.
Start small. Prove oracledb_up. Check exporter scrape health. Add one sessions panel. Add one activity or wait panel. Compare those panels against application latency during a real workload. Once the database appears in the same timeline as the application, the conversation changes from “the database was slow” to “here is what changed, when it changed, and where we should investigate next.”

You must be logged in to post a comment.