
Key Takeaways
- The load generator is part of the benchmark instrument, not background plumbing. If the client saturates first or changes the arrival pattern under stress, later Go-versus-Java charts stop meaning what they appear to mean.
- For this series, the primary generator is
benchctl, the compact Go load driver in the benchmark package. We selected it because it can hold an explicit rate, retain per-request artifacts, and fit the series’ Linux-and-Bash workflow without hiding the method behind another framework. - Coordinated omission is not benchmark trivia. If the client naturally slows down during a stall, tail latency can look cleaner than the arriving workload actually experienced, so our main latency evidence uses fixed-rate pressure rather than purely response-paced discovery.
- Headroom is a gate, not an assumption. The accepted validation evidence keeps the generator below the 80% CPU gate at selected target rates, proves margin with a known-fast control service, and keeps client-limited cells as failure evidence instead of quietly promoting them into the comparison.
If you want a skeptical reader to trust the later benchmark charts, you have to earn that trust before the first results article.
That starts with the client.
A load generator can flatten throughput for the wrong reason, hide a stall behind response-paced behavior, or become the busiest process on the machine before the service under test is actually in trouble. In a single-machine series, the risk is even sharper because client and service share the same CPUs, caches, memory bandwidth, scheduler behavior, and loopback path.
That is why this article exists between the implementation work and the full benchmark-method article. Before we talk about warmup, repeats, CPU shaping, or result analysis, we need to show that the driver itself deserves trust.
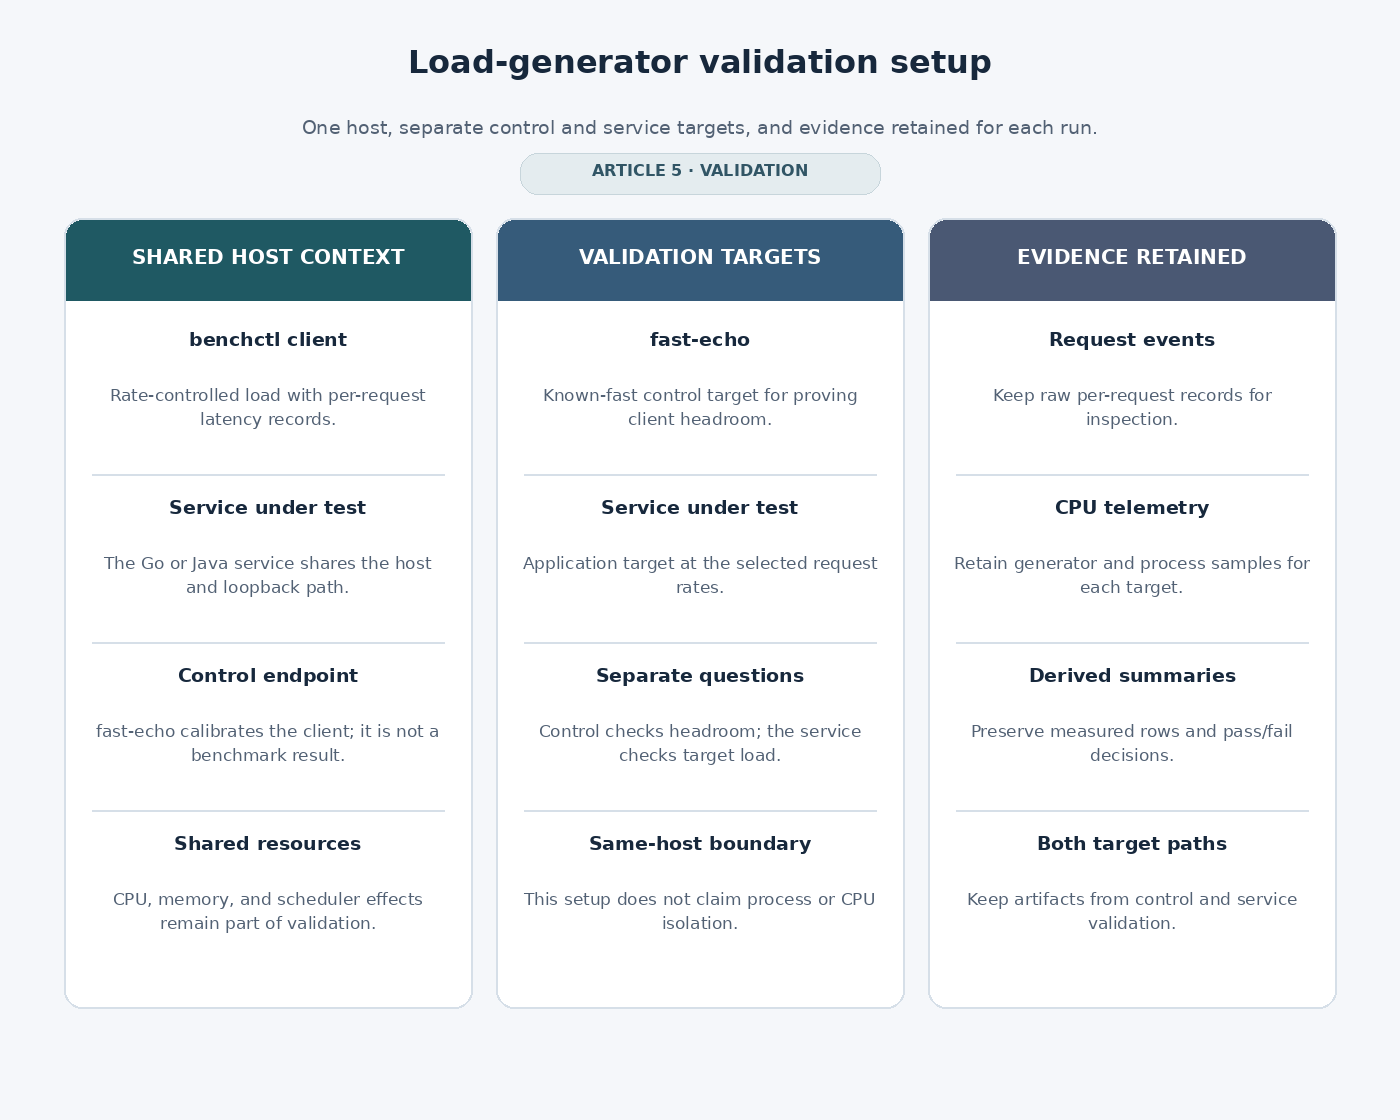
Figure 1. We validate the load generator as part of the measurement instrument: one host, one rate-controlled client, explicit CPU capture, and retained artifacts for both the control endpoint and the service under test.
Why the load generator gets its own article
Benchmark readers usually know the obvious failure mode: the client tops out before the server does.
The more dangerous failure mode is quieter. The client still looks plausible, the throughput line still climbs, and the latency summary still looks neat enough to publish. But once the service begins to stall, the client changes its own behavior and stops applying the pressure you thought you were measuring.
That is how a benchmark can look disciplined while still telling the wrong story.
So we treat the load generator as part of the measurement apparatus, not as setup glue. If we would not trust a server-side result without knowing the runtime flags, CPU limits, and logging state, we should not trust a client-side result without knowing the pacing model, telemetry, and headroom either.
This article’s claim is narrow on purpose. We are not trying to prove a universal winner among HTTP load tools. We are trying to prove something more useful for this series: the chosen client is unlikely to be the dominant limiter at the rates we plan to measure, and the harness tells us when that stops being true.
What the generator has to do in this series
The generator has to support the benchmark question, not just produce traffic.
For this series, that means it must drive requests at explicit target rates, preserve latency events that can be inspected later, record client-side errors, and fit into a repeatable Linux/Bash workflow. It also has to work with the same artifact discipline as the services under test: raw event streams, process samples, derived summaries, and clear pass/fail decisions.
That combination matters because the later articles compare Go net/http, Java Helidon on an Oracle-built JDK, and the Oracle JDK AOT/cache path under controlled single-machine conditions. The load tool cannot be a black box in that comparison. It must expose enough evidence for a reader to ask, “Was the client the limiter?” and get a concrete answer.
What we selected and why
For this series, the primary generator is benchctl, the compact Go load driver that ships with the benchmark package.
That choice is about fit, not prestige.
We needed a generator that could do three things well. First, it had to support explicit target rates, because the series is asking not only how fast a service can run in a closed loop, but also what happens when requests keep arriving at a planned rate. Second, it had to retain inspectable per-request artifacts rather than just printing a final aggregate line and disappearing. Third, it had to fit a Bash-first workflow cleanly so the benchmark remained easy to audit.
benchctl met those requirements directly. It supports closed-loop discovery when we want a rough ceiling, fixed-rate runs when we want evidence-bearing latency rows, and raw JSONL artifacts that preserve each measured request. That last point matters. Later analysis can inspect what the client actually did instead of trusting a single terminal summary.
Just as important, benchctl is part of the same source package as the services and the control endpoint. That makes it easier to tie request artifacts, process sampling, target-rate selection, and headroom checks into one reproducible flow.
We still keep the claim bounded. Choosing a tool does not prove the benchmark is fair. It only tells you which instrument we are putting under scrutiny.
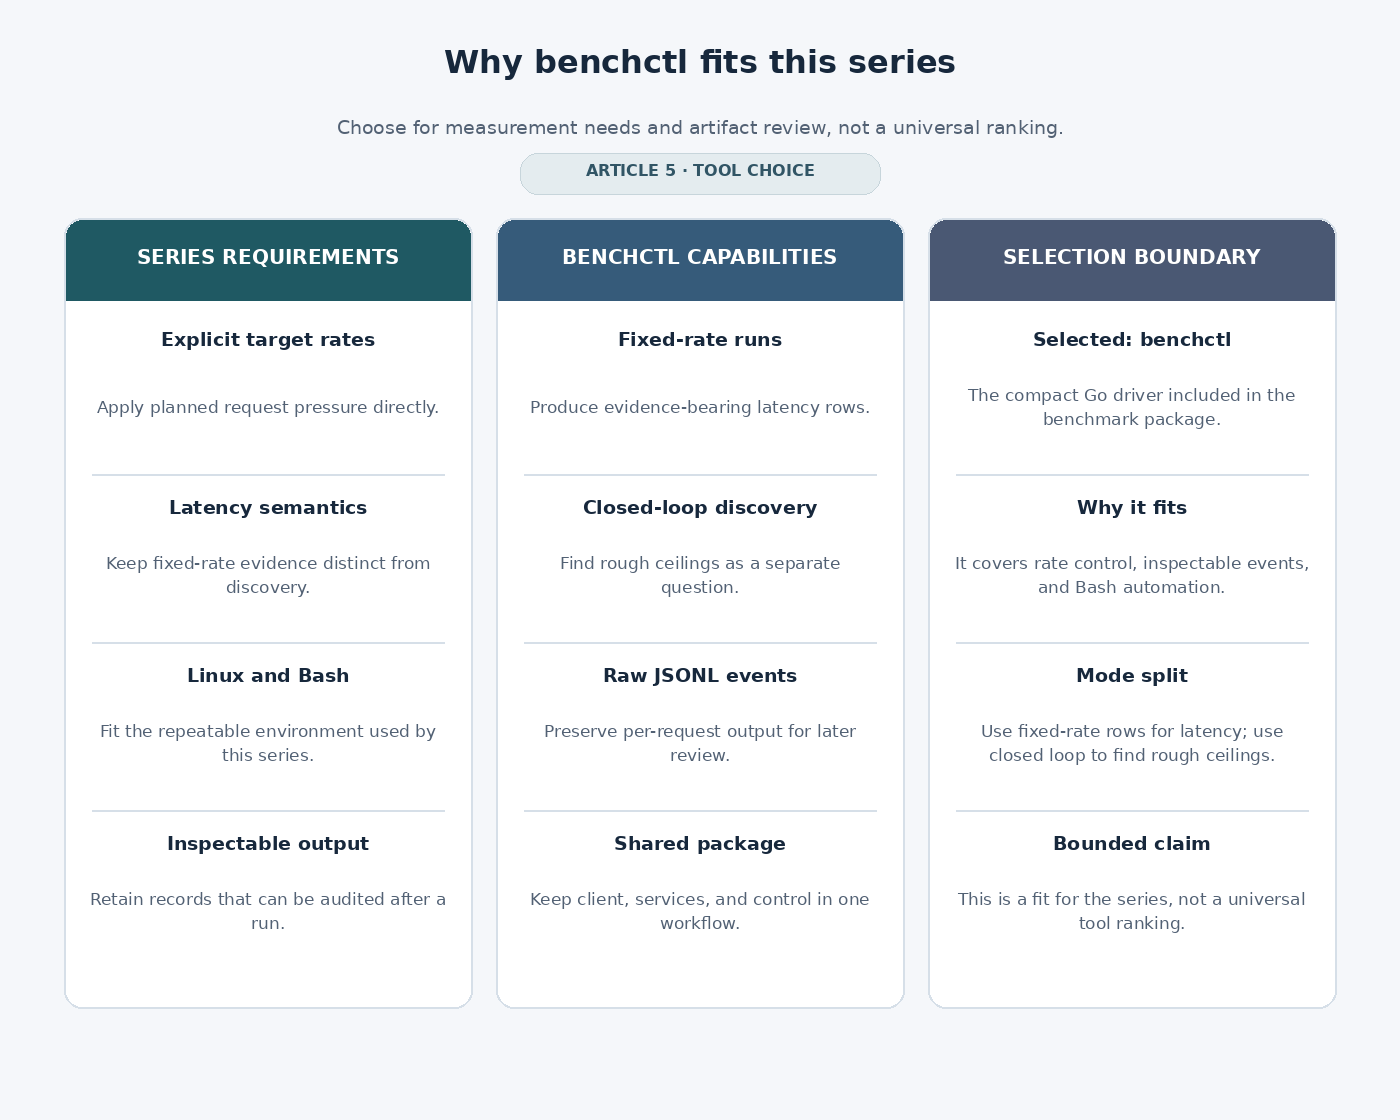
Figure 2. We selected the generator that best fits this series’ trust requirements: explicit rate control, inspectable latency output, Linux and Bash automation fit, and reproducible artifact capture.
Why coordinated omission matters here
A response-paced client answers one question. A fixed-rate client answers another.
With response-paced load, new requests are naturally coupled to earlier responses finishing. If the service stalls, the client slows down too. That makes the worst part of the stall look cleaner than it should because fewer new requests arrive while the system is already struggling.
That is coordinated omission in practical terms: the client quietly stops applying pressure at the exact moment when arriving work would still have been feeling delay.
This does not mean closed-loop discovery is useless. We still use it to find rough ceilings and to expose where a given client shape begins to saturate. But it is not our main latency evidence. For the benchmark question in this series, the important row is the one where requests continue arriving at the configured rate and the latency record shows what that pressure looked like.
So the policy is simple. Evidence-bearing latency rows use fixed-rate pressure. Closed-loop discovery remains useful, but if it saturates the client or answers a different pacing question, it does not become the row we cite as the main latency result.
That distinction is one of the reasons the retained raw event stream matters so much. It gives us enough detail to audit the run later instead of treating the client as a black box.

Figure 3. Response-paced load can appear cleaner than it should during a stall because the client naturally slows down. Our policy uses scheduled pressure so the latency record better reflects what arriving work experienced.
The validation rule: prove headroom before a run counts
The operational rule is intentionally strict.
In this series, the load generator has to stay below a sustained 80% CPU gate at the selected target rates, and a separate known-fast control service has to prove throughput margin above the service-under-test demand.
Those are two different checks, and we need both.
The CPU gate catches the obvious problem: the client itself is running out of room. The control-service gate catches a subtler one: a client can stay under its CPU threshold and still fail to provide enough throughput margin for the real benchmark.
The control service in this package is fast-echo, a deliberately boring HTTP target. It is not part of the Go-versus-Java comparison. Its job is narrower than that. It tells us whether the client can comfortably exceed the throughput band selected for the benchmark cells.
This is also where negative evidence becomes useful instead of embarrassing. If a discovery cell or a control attempt saturates the client, we keep it. It becomes proof that the gate is working, not something we quietly discard.
What the validation showed
The important point is that the current package contains validation evidence, not just a policy.
The accepted fixed-rate probes were used to choose the final controlled-load rates. The final rate-selection note accepted 200, 400, and 800 requests per second for the long benchmark. That decision was based on fixed-rate probes, not on a closed-loop capacity leaderboard.
The evidence is compact enough to show directly:
- Lower fixed-rate probe
- Scope:
100and200req/s across the required Oracle-built-JDK comparison shape - Accepted evidence:
108rows;162,000measured requests; all2xx; zero errors;108/108saturation rows passed - Load-generator CPU result: Maximum reported load-generator CPU:
15.559802% - Why it matters: Supports
200 req/sas a clean selected rate
- Scope:
- Higher fixed-rate probe
- Scope:
400and800req/s across the same required variants, fixtures, CPU shapes, and concurrency levels - Accepted evidence:
108rows;648,000measured requests; all2xx; zero errors;108/108saturation rows passed - Load-generator CPU result: Maximum reported load-generator CPU:
40.503938% - Why it matters: Supports
400and800 req/sas clean selected rates
- Scope:
- Final controlled-load run
- Scope: Selected
200,400, and800req/s rates - Accepted evidence:
486measured cells;6,804,000measured non-warmup requests; all2xx; zero request errors - Load-generator CPU result: After excluding terminal shutdown sampler rows with zero CPU ticks and zero file descriptors,
486/486cells passed; maximum adjusted load-generator CPU:44.447241%; maximum adjusted average load-generator CPU:23.722782% - Why it matters: Shows the final selected rates were driven below the load-generator CPU gate
- Scope: Selected
fast-echocontrol- Scope: Known-fast local control endpoint
- Accepted evidence: Best observed control throughput:
38,067.4 req/sat concurrency64; zero request errors - Load-generator CPU result: Control run used for client headroom, not service ranking
- Why it matters: Demonstrates client-side headroom above the selected
800 req/sceiling
The final controlled-load run deserves one extra explanation. The canonical saturation check flagged 51 terminal process-sampler rows where CPU tick counters decreased as the load-generator process exited. The supplemental audit ignored only terminal shutdown rows with zero CPU ticks and zero file descriptors, then found all 486 measured cells passing the adjusted saturation check. That is a narrow correction for process shutdown sampling, not a broad waiver for inconvenient data.
The fast-echo control run gives the other half of the headroom story. In the Oracle-only headroom manifest, the known-fast control service reached 38,067.4 requests per second at concurrency 64, with zero request errors, in a short local headroom run. That is not a service-under-test benchmark result. It is instrument validation: evidence that the client and local path can exceed the selected final controlled-load rates by a wide margin.
That is what we want from a benchmark harness. Not “the client always wins,” but “the harness shows where a client shape stops being safe.”
Why the control endpoint matters more than a pretty throughput number
A control endpoint is easy to misunderstand.
Readers see an echo-style endpoint and assume the article is trying to sneak in a flattering benchmark number. That is not the point. The control target is not there to rank services. It is there to calibrate the measurement instrument.
To do that well, the endpoint has to be intentionally simple: stable body, stable status, no database call, no downstream RPC, no template rendering, no application-specific hot path. The more boring it is, the more useful it becomes for this job.
fast-echo did exactly what we needed. It showed that the client could exceed the selected benchmark demand in a passing shape, and it also exposed whether a client shape was not good enough. Both outcomes matter. A passing control proves headroom. A failing control proves the gate is real.
That is why the control-service evidence belongs here even though it is not a benchmark result in the usual sense.
What this still does not prove
This validation clears an important hurdle, but it does not answer every benchmark question.
It does not turn same-host measurement into a separate load-generator host. Client and service still share CPUs, caches, memory bandwidth, scheduler behavior, and loopback networking. Those interactions can still matter, especially in the tail.
It does not mean closed-loop discovery is bad or fixed-rate pressure is perfect. Those modes answer different questions, and we use them differently on purpose.
It does not prove that the later Go or Java implementation is faster. The claim here is narrower: the current load generator, saturation gate, and control proof are strong enough that the next article can talk about benchmark methodology without leaving the client as an unexamined weak spot.
That is the right level of confidence for this stage.
Acceptance criteria before any benchmark run counts
Before a later Go-versus-Java cell can count as benchmark evidence in this series, it has to clear the same contract:
- Correct pacing mode: evidence-bearing latency rows use the series’ fixed-rate mode, not an accidental response-paced fallback.
- Generator CPU below the gate: the load generator must stay below the sustained 80% CPU threshold for the target cell.
- Control-service headroom: the known-fast control service must show throughput above the selected benchmark demand.
- No hidden client failure: rows with client saturation, unstable scaling, missing telemetry, or client-side errors are kept as failure evidence, not promoted into comparison data.
- Retained artifacts: raw request events, process samples, and derived summaries must be present so the run can be audited later.
Those rules are strict because they need to be. A series that plans to compare languages and runtime shapes needs hard acceptance criteria long before it needs opinions.
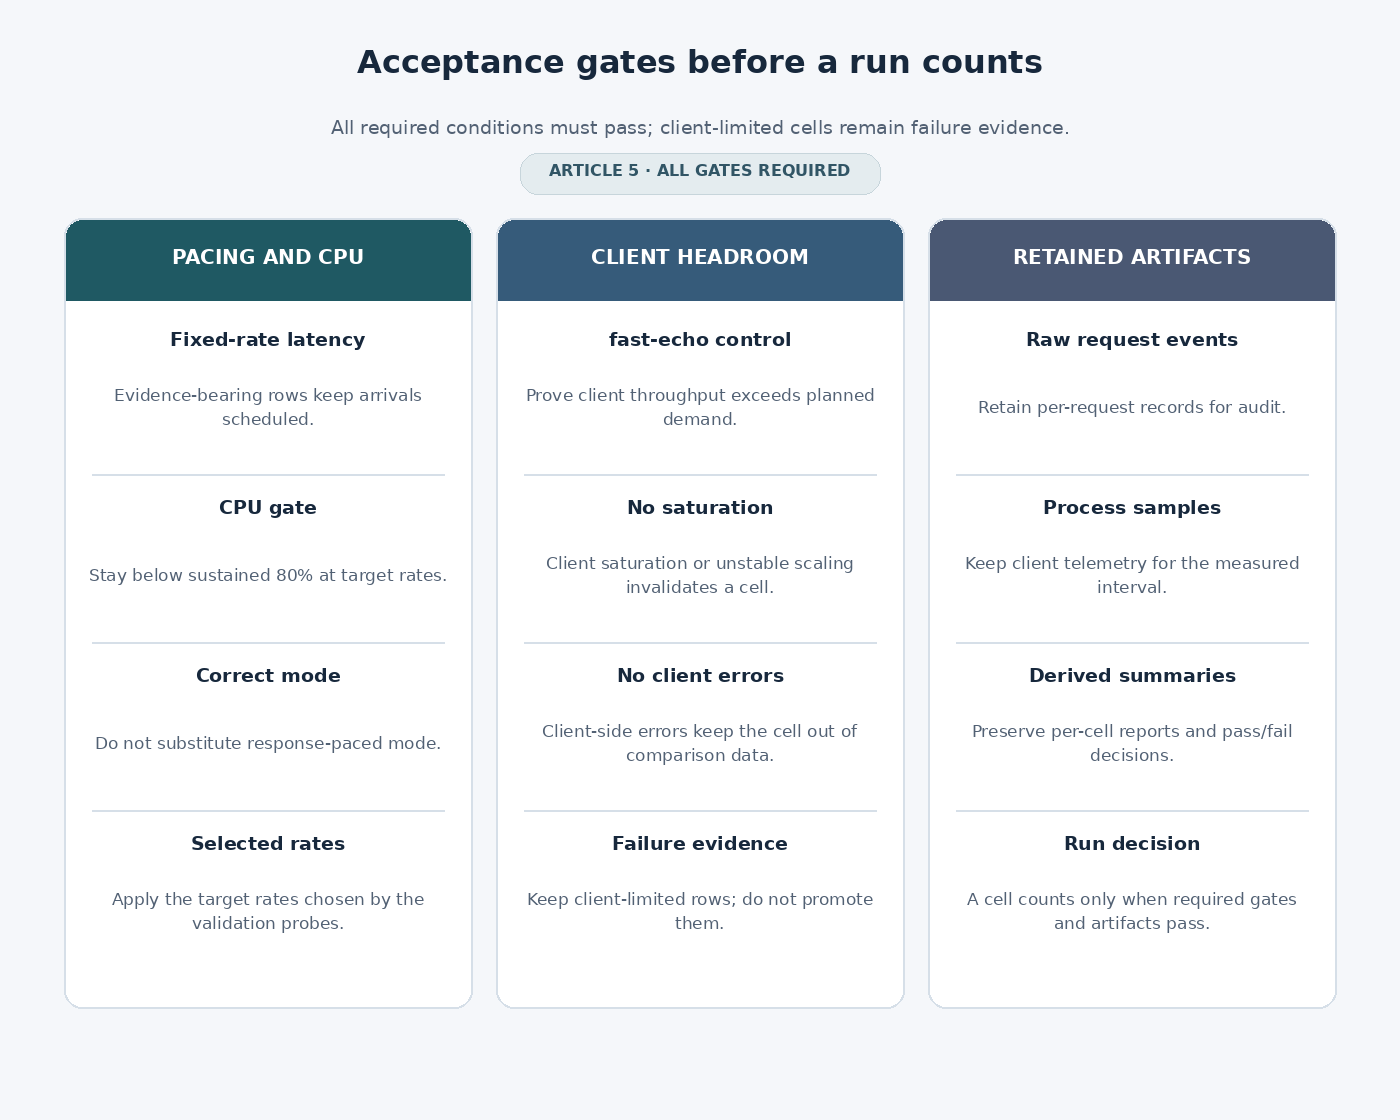
Figure 4. A benchmark run only counts after the instrument passes: right tool mode, valid control proof, acceptable CPU headroom, retained artifacts, and no client-side saturation.
What this unlocks next
With the load tool validated, the next article can focus on benchmark methodology instead of first arguing about whether the client was the real limiter.
That changes the conversation in a useful way. We can move on to warmup policy, measurement windows, repeat counts, CPU-shape rules, invalid-run handling, and reproducibility knowing that the client side already has a defined contract and bounded proof behind it.
There is still plenty left to scrutinize. There should be. But the next scrutiny can be about the method and the service behavior, not about an unproven driver hiding in the background.
Conclusion
The benchmark before the benchmark is the load generator.
For this series, we selected benchctl because it matches the method we actually need: explicit rate control, inspectable raw artifacts, and tight integration with the package’s validation flow. We then validated it the way a measurement instrument should be validated, not the way a convenience tool is usually waved through.
The important result is not that every client shape passed. It is that the harness selected final controlled-load rates only after clean fixed-rate probes, then carried the same headroom discipline into the final matrix. The final accepted rates are 200, 400, and 800 requests per second. The accepted probes reached those rates without request errors or load-generator saturation, the final controlled run stayed below the load-generator CPU gate after accounting for terminal sampler shutdown rows, and the fast-echo control showed substantial local client headroom above the selected ceiling.
That does not settle the Go-versus-Java question. It settles the more basic question first: whether later runs are being driven by a tool we have reason to trust.
References and Methodology Notes
- Result-package artifact:
demos/go-java-go-benchmark/manifests/recovery-fixedprobe-20260620T0100Z.csv - Result-package artifact:
demos/go-java-go-benchmark/manifests/recovery-fixedprobe-hi-20260620T0200Z.csv - Result-package artifact:
demos/go-java-go-benchmark/manifests/recovery-final-controlled-20260620T0230Z.csv - Result-package artifact:
demos/go-java-go-benchmark/manifests/headroom-fast-echo-control-oracle-only-20260619T1103Z.json - Result-package artifact:
diagnostics/final_rate_selection_20260620.md - Result-package artifact:
diagnostics/fixedprobe_highrate_audit_20260620.md - Result-package artifact:
diagnostics/final_controlled_benchmark_audit_20260620.md - Result-package artifact:
demos/go-java-go-benchmark/docs/artifact-policy.md - HDR Histogram: background on coordinated omission, latency recording, and percentile interpretation. https://hdrhistogram.github.io/HdrHistogram/
- Linux
sched(7): background on Linux scheduling behavior relevant to same-host benchmark limitations. https://man7.org/linux/man-pages/man7/sched.7.html

You must be logged in to post a comment.