
This article uses Oracle Database Metrics Exporter 2.3.1, checked against Oracle’s documentation on 2026-05-10. Container image: container-registry.oracle.com/database/observability-exporter:2.3.1. Default listen address: :9161. Default metrics path: /metrics.
In the first article in this series, we looked at why application telemetry stops at the service boundary — and why a slow RAG endpoint or AI request often cannot be diagnosed without knowing what Oracle Database was doing at the same moment. This article turns that idea into a working local setup.
We’ll run Oracle Database Metrics Exporter against a development Oracle Database, scrape it with Prometheus, connect Grafana, and build the starter dashboard. By the end you’ll have panels showing exporter health, database reachability, sessions, activity, wait categories, and top SQL — all in the same time window as your application metrics.
Oracle’s docs and GitHub materials sometimes use Oracle AI Database Metrics Exporter where the product page uses Oracle Database Metrics Exporter. You may also see observability-exporter in the container image path. In this article, those references point to the same exporter.
The stack
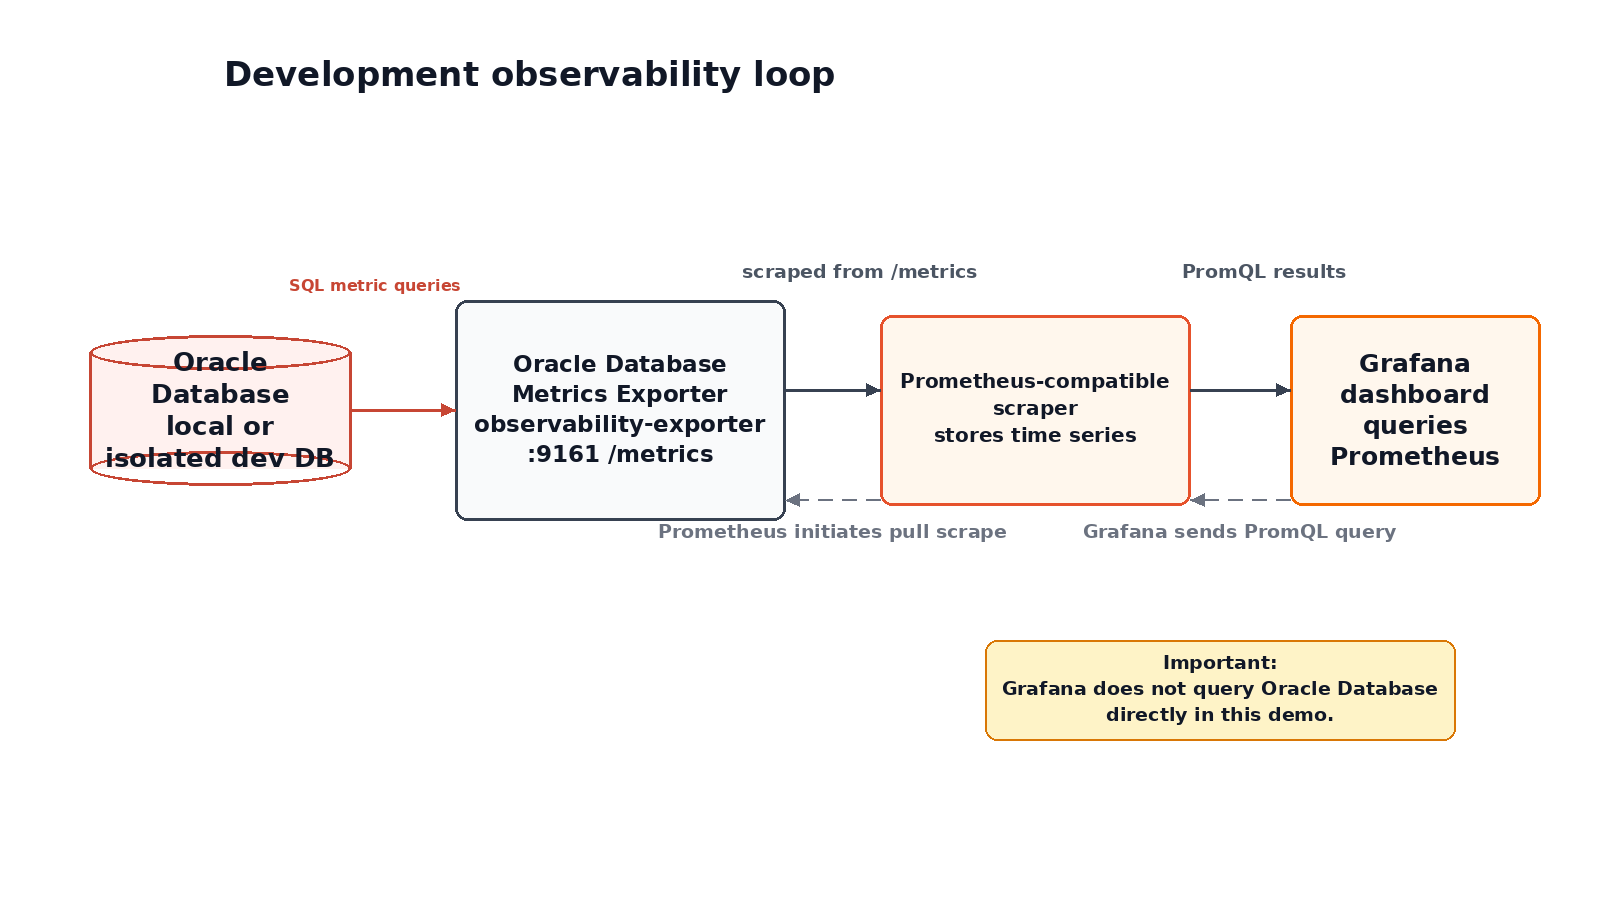
The exporter sits between Oracle Database and Prometheus. It connects to the database, runs the metric queries, and exposes the results at /metrics. Prometheus pulls those metrics on a schedule. Grafana queries Prometheus to build panels.
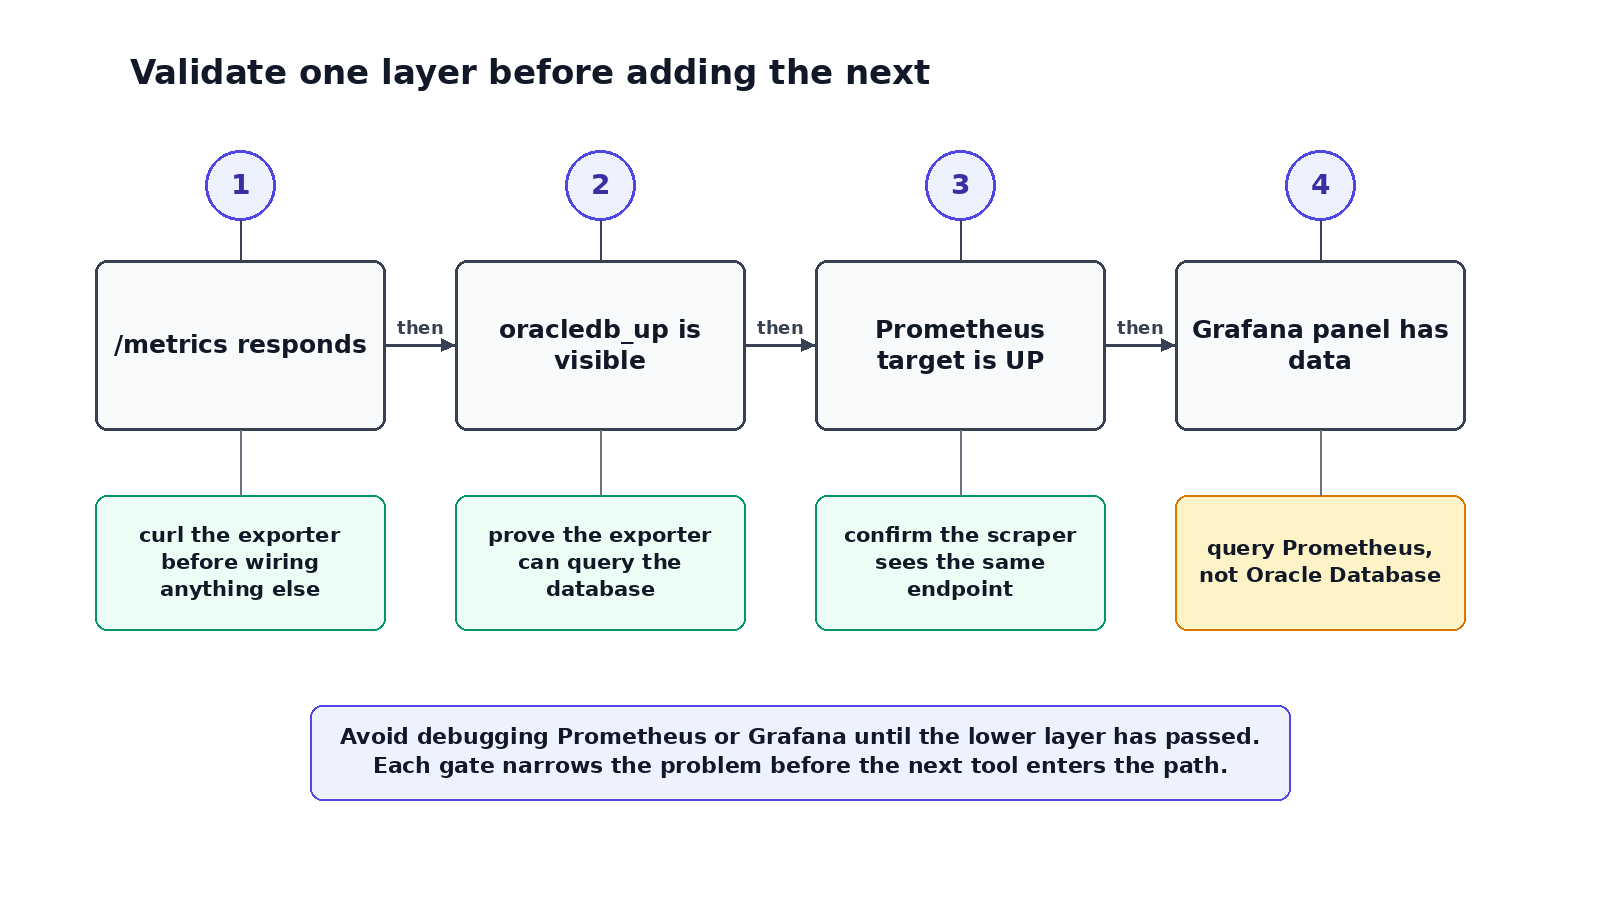
Grafana does not connect directly to Oracle Database in this setup. That distinction matters when something goes wrong: if a panel is empty, the problem is almost always earlier in the chain. We’ll verify each link before moving to the next.
What you need
- A development Oracle Database — local container, OCI Always Free, or a private lab instance
- SQL admin access to create a monitoring user in the target PDB or service
- Docker
- Local ports 9161, 9090, and 3000 free
For Prometheus and Grafana, use pinned stable releases. Check github.com/prometheus/prometheus/releases and github.com/grafana/grafana/releases, then set these once in your shell:
export PROMETHEUS_IMAGE="prom/prometheus:v3.3.0"export GRAFANA_IMAGE="grafana/grafana-oss:11.5.0"
Substitute the current stable tags. All the container commands below reference these variables so you only change the version in one place.
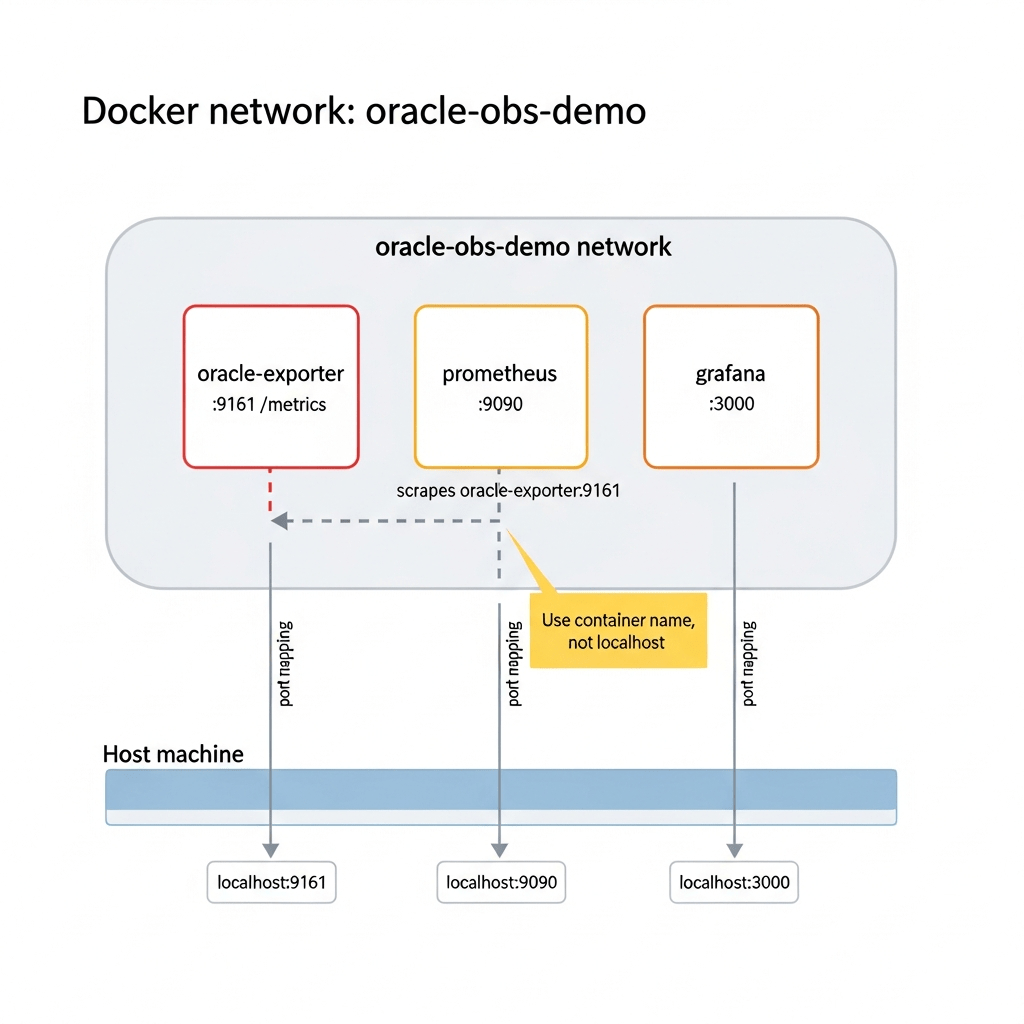
Create a shared Docker network
The three containers need to reach each other by name. Create a dedicated network first:
docker network create oracle-obs-demo
If Oracle Database is already running as a local Docker container, attach it to this network:
docker network connect oracle-obs-demo <your-oracle-container>
With Oracle Database on the same Docker network, the exporter can reach it by container name. If Oracle Database is running on the host machine instead, use host.docker.internal as the hostname in the exporter connect string.
Create a monitoring user
The exporter needs its own database identity. Connect to the PDB or service you want to monitor and run:
-- Run with an admin account in the target PDBcreate user exporter_demo identified by "<your_password>";grant create session to exporter_demo;grant select_catalog_role to exporter_demo;
SELECT_CATALOG_ROLE covers most of the default metrics without requiring a long list of individual view grants. It is a broad grant — convenient for a local demo, but not least-privilege for a shared environment. Narrowing this down is the main topic of the next article in this series.
With Oracle Database Free, the default PDB is FREEPDB1. Make sure you create the user in the service the exporter will connect to.
Configure the exporter
Create a local file with the connection details. Keep this file out of source control.
# exporter.envDB_USERNAME=exporter_demoDB_PASSWORD=<your_password>DB_CONNECT_STRING=<host>:1521/<service-name>
Replace <host> with the address the exporter container can reach. If Oracle Database is another container on oracle-obs-demo, use its container name: for example, oracle-db:1521/FREEPDB1. If it’s running on the host, use host.docker.internal:1521/FREEPDB1.
echo "exporter.env" >> .gitignore
Start the exporter
docker run -d --name oracle-exporter --network oracle-obs-demo --env-file ./exporter.env -p 127.0.0.1:9161:9161 container-registry.oracle.com/database/observability-exporter:2.3.1
Check the logs to confirm a clean start:
docker logs oracle-exporter
Then verify the metrics endpoint:
curl -s http://localhost:9161/metrics | grep "^oracledb_up"
A working exporter shows:
oracledb_up 1
That 1 means the exporter connected to Oracle Database and ran its queries successfully. If you see 0, the HTTP server is running but the database connection is not — check the connect string, service name, credentials, and whether the user exists in the right PDB. If the endpoint is unreachable, check docker ps and docker logs oracle-exporter.
Before moving on, take a quick look at what the exporter actually exposes:
curl -s http://localhost:9161/metrics | grep "^# HELP oracledb_" | head -20
This lists the metric names and descriptions for version 2.3.1. The PromQL queries in the sections below assume the default metric names from this version.
Add Prometheus
Create the scrape configuration:
# prometheus.ymlglobal: scrape_interval: 15sscrape_configs: - job_name: oracle-exporter metrics_path: /metrics static_configs: - targets: - oracle-exporter:9161
The target is oracle-exporter:9161 — the exporter’s container name on the Docker network. Prometheus will resolve that name from inside the network. Using localhost:9161 would point at the Prometheus container itself.
Start Prometheus:
docker run -d --name prometheus --network oracle-obs-demo -p 127.0.0.1:9090:9090 -v "$(pwd)/prometheus.yml:/etc/prometheus/prometheus.yml:ro" "$PROMETHEUS_IMAGE" --config.file=/etc/prometheus/prometheus.yml
Open http://localhost:9090 and go to Status → Targets. The oracle-exporter job should show UP.
Confirm both signals in the query UI before continuing:
up{job="oracle-exporter"}
oracledb_up
up{job="oracle-exporter"} is whether Prometheus can scrape the exporter. oracledb_up is whether the exporter can reach Oracle Database. Both should return 1 before building any panels.
Add Grafana
docker run -d --name grafana --network oracle-obs-demo -p 127.0.0.1:3000:3000 "$GRAFANA_IMAGE"
Open http://localhost:3000 and log in. Default credentials for a fresh Grafana container are admin / admin.
Add Prometheus as a data source: Connections → Data sources → Add new data source → Prometheus. Set the server URL to:
http://prometheus:9090
Not http://localhost:9090 — Grafana is running inside Docker, where localhost means the Grafana container. Use the container name.
Save and test. When it shows connected, you’re ready to build panels.
Build the starter dashboard
Create a new dashboard. The panels below build from monitoring-chain health outward to database behavior. Start at the top and work down.
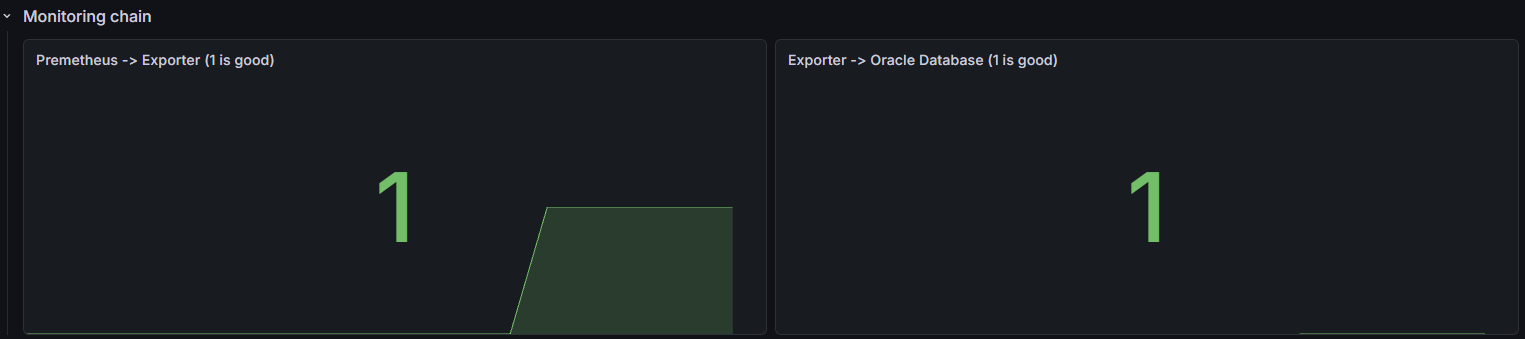
Is the monitoring chain working?
Two stat panels, side by side.
Prometheus → Exporter:
up{job="oracle-exporter"}
1 means Prometheus can scrape the exporter. 0 means the exporter is down or unreachable.
Exporter → Oracle Database:
oracledb_up
1 means the exporter has a working database connection. 0 means the exporter is alive but cannot reach the database.
These two panels separate the first layer of any debugging conversation: is the monitoring chain itself broken, or is the database the problem?
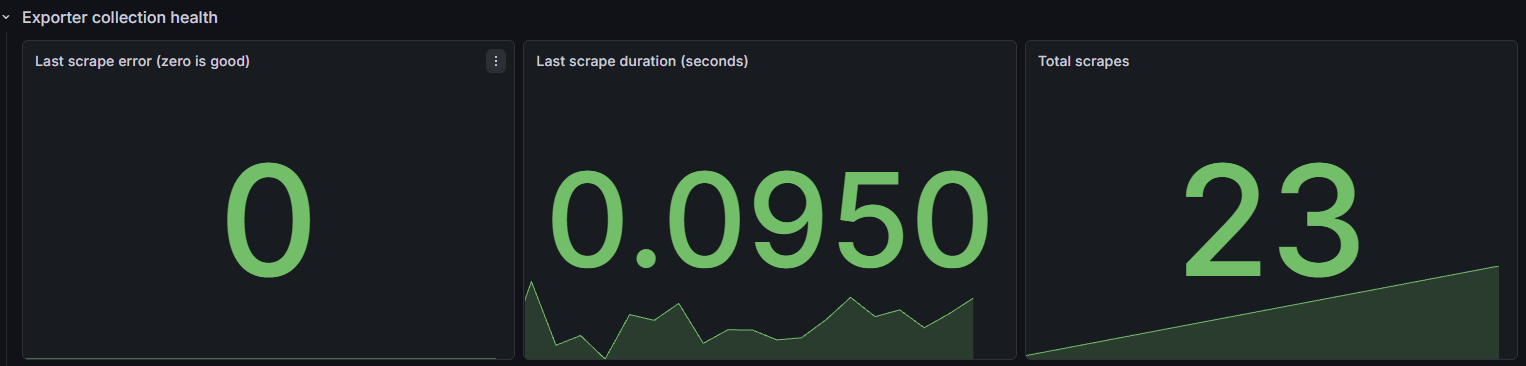
Exporter collection health
oracledb_exporter_last_scrape_error
Healthy value is 0. A nonzero value means the last collection had errors — often a permissions issue, a query timeout, or a broken custom metric configuration.
oracledb_exporter_last_scrape_duration_seconds
How long collection takes per scrape. If this climbs toward the scrape interval, the exporter is struggling to keep up — usually a slow query or high database load.
oracledb_exporter_scrapes_total
A running total of completed scrapes. Useful for confirming the exporter is actively collecting and not stalled.
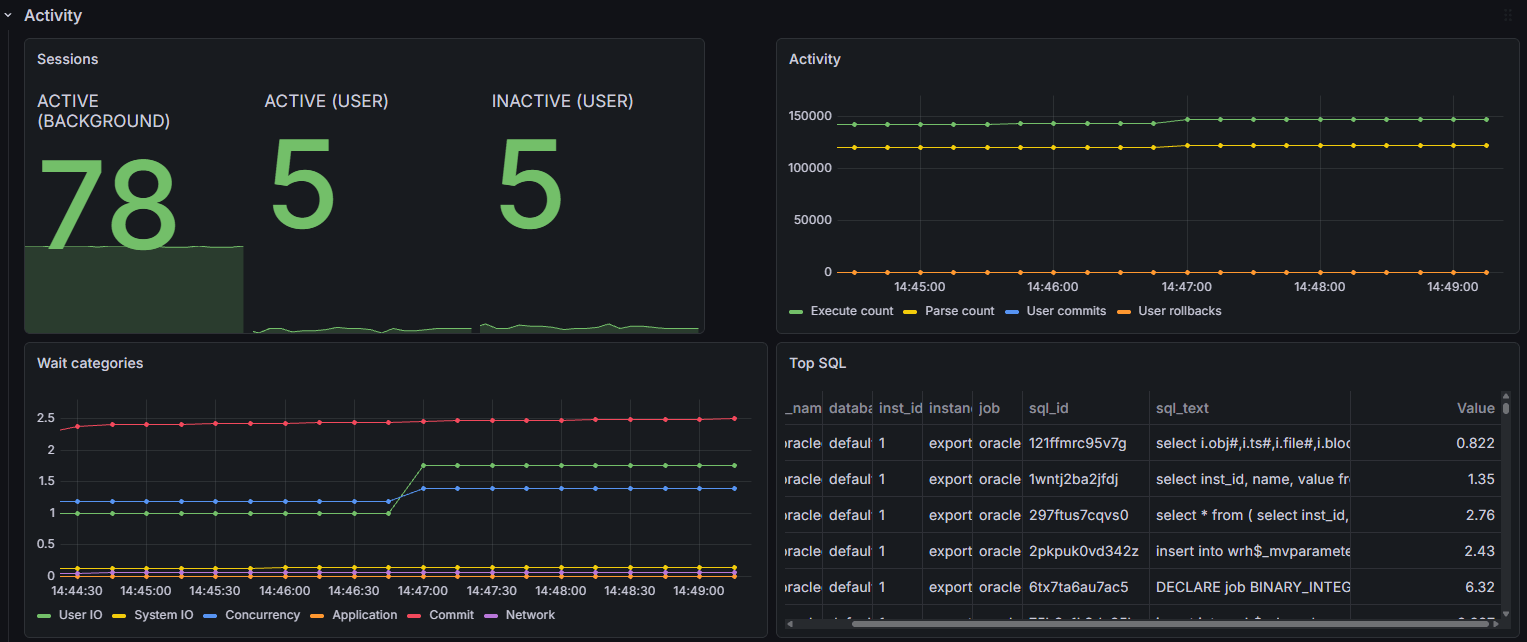
Sessions
sum by (status, type) (oracledb_sessions_value)
Database sessions are not the same as active users. They include connection pool slots, background processes, and idle sessions. The useful question is not the absolute value — it is whether the shape changes at the same time as an application event. Did sessions spike when the slow request hit? Did inactive sessions accumulate after a deployment?
Activity
oracledb_activity_execute_count
oracledb_activity_parse_count_total
oracledb_activity_user_commits
oracledb_activity_user_rollbacks
These show whether the workload shape changed. A jump in execute or parse count often corresponds to a new query pattern, a connection pool opening more sessions, or a batch job starting. Compare them against application request volume on the same time axis.
The default Oracle activity metrics are gauges, not counters. Graph them directly. Only apply rate() after checking the # TYPE line for your exporter output.
Wait categories
oracledb_wait_time_user_iooracledb_wait_time_system_iooracledb_wait_time_concurrencyoracledb_wait_time_applicationoracledb_wait_time_commitoracledb_wait_time_network
Wait categories show where database time is going. They do not explain why a wait increased, but they tell you which direction to investigate next. User I/O rising with application latency is a different path than concurrency rising after a schema change.
The wait metrics are counters. For a rate-of-change view:
rate(oracledb_wait_time_commit[5m])
Top SQL
topk(10, oracledb_top_sql_elapsed)
This surfaces the SQL statements accumulating the most elapsed time. In a development setup it is the fastest way to find which query to look at next. The label set includes SQL identifiers and may include SQL text — useful locally, but worth reviewing before this panel goes into a shared dashboard.
Reading the dashboard
Once the panels are in place, run a real request through your application and watch the time window in Grafana.
Make a call to your RAG endpoint or Spring Boot AI service. During that window:
- Did
oracledb_sessions_valuespike? Session pressure often shows up alongside connection pool wait time. - Did execute or parse count shift? More SQL activity usually means a different query pattern or a job running in parallel.
- Did a wait category increase? User I/O rising with latency points toward reads. Concurrency rising points toward lock contention.
- Did anything appear at the top of
oracledb_top_sql_elapsed? That is the query to look at next.
None of this closes the investigation. What it gives you is a set of specific hypotheses to test — which is what the first article described as the goal.
Clean up
docker rm -f grafana prometheus oracle-exporterdocker network rm oracle-obs-demorm -f exporter.env
If you attached an existing Oracle Database container to the demo network, disconnect it first:
docker network disconnect oracle-obs-demo <your-oracle-container>
What’s next
The demo works. The question now is what it takes to run this reliably alongside a real application.
In the next article, we look at what productionizing the exporter actually requires: replacing the broad SELECT_CATALOG_ROLE grant with object-level grants for the metrics you enable, keeping the exporter endpoint private, reviewing which labels leave the database boundary, and making sure someone owns the component before it becomes a dependency nobody maintains.

You must be logged in to post a comment.