
The local demo worked.
/metrics responds. Prometheus scrapes the target. Grafana shows panels. Maybe oracledb_up is 1 in your deployed version, and database-side signals finally sit near application latency, deployment events, queue behavior, and other service telemetry.
That is a useful milestone.
It is not production readiness.
Productionizing Oracle Database Metrics Exporter means controlling what the exporter can read, who can scrape it, what labels leave the database boundary, and who owns alerts, dashboards, runbooks, upgrades, and readiness review.
A working local scrape proves that Oracle Database Metrics Exporter can connect to a database and expose metrics in a Prometheus-compatible format. Production asks a different set of questions. What database identity does the exporter use? Which database views and tables can that identity read? Where are credentials, connect strings, and wallets stored? Who can scrape /metrics? Which labels leave the database boundary? Are custom SQL metrics safe at production scale? Which alerts page humans? Who owns the exporter when it breaks?
The production model is simple to state and easy to underestimate:
Treat Oracle Database Metrics Exporter as both a privileged Oracle Database client and a private scrape target.
That is the thesis of this article. Productionizing Oracle Database Metrics Exporter is not mainly about getting another container to run. It is about controlling what the exporter can read, who can scrape it, what labels leave the database boundary, and who owns the alerts, dashboards, runbooks, upgrades, and rollback path.
For developers building AI and database-backed applications, this matters because Oracle Database may sit directly in the request path. A RAG service might use vector search, JSON metadata filters, relational joins, queue tables, conversation memory, and audit writes. An agentic workflow system may persist state, tool calls, retries, and human approval steps. An ingestion service may compete with retrieval traffic.
When those systems slow down, database observability becomes part of user experience.
The production controls, however, are not AI-specific. They are the same controls you would want for any database-backed service: least privilege, protected credentials, private scraping, reviewed labels, safe custom SQL, actionable alerts, and owned runbooks.
In From Oracle Database to Grafana: What Oracle Database Metrics Exporter Does for Developers, we looked at why Oracle Database signals belong beside application telemetry. In Hands-on: Run Oracle Database Metrics Exporter with Prometheus and Grafana, we proved the local path with Oracle Database Metrics Exporter, Prometheus, and Grafana. We validated /metrics, checked database reachability metrics, confirmed Prometheus target health, and built starter panels.
This article starts where that demo stops.
Oracle Database Metrics Exporter is not trying to be Oracle Enterprise Manager, OCI Database Management, or a commercial APM/database-monitoring suite. Those platforms can provide broader discovery, incident management, tuning workflows, dashboards, and operational governance, depending on deployment, licensing, configuration, and operating model. The exporter’s value is narrower: it brings Oracle Database metrics into Prometheus-compatible pipelines that many developer platforms already operate.
That narrower scope is useful. It also means production readiness is your responsibility.
A few terms before the production review
Before we move into the review path, it helps to fix the vocabulary. The terms are common, but small differences matter in production conversations.
An exporter is a process that collects or queries data from another system and exposes it in a metrics format. In this case, Oracle Database Metrics Exporter connects to Oracle Database and exposes metrics for a scraper.
A scraper is a monitoring component, usually Prometheus or an OpenTelemetry Collector Prometheus receiver, that periodically reads the exporter’s metrics endpoint.
Least privilege means granting only the database and platform access needed for approved metrics, not broad access because it is convenient.
A custom SQL metric is a metric defined by an operator or application team using a SQL query, rather than a default metric shipped with the exporter.
Label cardinality is the number of distinct label values, or label combinations, that a metric can produce.
A runbook is a short operational document that tells responders what an alert means, what to check first, how to reduce impact, and when to escalate.
A production-readiness review is a pre-rollout review that checks identity, grants, secrets, network exposure, metrics, labels, alerts, dashboards, runbooks, ownership, upgrades, and rollback criteria.
Those definitions matter because they keep the review grounded. This is not only a deployment review. It is a trust-boundary review.
Version and naming notes
Verify names, image paths, and tags against the current Oracle documentation before rollout.
Useful source anchors include:
- Oracle Database Metrics Exporter product page
- Oracle GitHub repository:
oracle-db-appdev-monitoring - Oracle project documentation
- Oracle installation docs
- Oracle GitHub releases
- Oracle Container Registry
At the time of writing (May 2026) the current version of Oracle Database Metrics Exporter is 2.3.1, and Oracle’s installation docs used an image path in the form container-registry.oracle.com/database/observability-exporter:2.3.1.
Treat that as a review point, not as a promise that your environment should use the same version.
Before rollout, verify the current release, image tag, command-line flags, default metrics, and configuration syntax against Oracle’s repository and documentation. Also inspect the runtime --help, the default metrics file for the exact tag, and live /metrics output from the image you deploy.
Understand how production changes the boundary
In local development, the topology is usually compact. One person can understand the whole path.
Developer laptop ├─ Oracle Database or test database ├─ Oracle Database Metrics Exporter ├─ Prometheus └─ Grafana
That setup is valuable because it proves the mechanics. The exporter can connect to Oracle Database. Prometheus can scrape it. Grafana can query Prometheus. The developer can troubleshoot each hop.
Production changes the boundary.

In local development, /metrics is a convenience. In production, /metrics is an internal data boundary.
In local development, broad test access may be acceptable for a disposable lab. In production, exporter grants must be reviewed metric by metric.
In local development, labels are exploratory. In production, labels affect cost, privacy, retention, remote write, dashboard access, and alert annotations.
In local development, the developer owns everything. In production, ownership must be explicit.
The readiness path is less about one deployment shape and more about a sequence of decisions.

This is a readiness flow, not a universal deployment architecture. It shows the decisions that turn “the demo works” into “this exporter is an operated production component.”
Bring the right context to the review
A production review cannot approve an exporter in the abstract. Reviewers need to know exactly what will run, what it will read, what it will expose, and who will operate it.
Bring the exporter version, image tag, runtime --help output, enabled default metrics, custom SQL metrics, and sample /metrics output from the deployed version. Bring the database topology, required grants, credential path, wallet or TCPS requirements, exporter-to-database network path, and scraper-to-exporter network path. Bring the Prometheus or OpenTelemetry Collector configuration, retention and remote-write destinations, dashboard audience, alert routing, upgrade plan, and rollback plan.
Database topology matters. A deployment may be single-instance, CDB/PDB, RAC, Autonomous Database, managed service, on-premises, cloud-hosted, or a combination. One grant recipe and one network policy rarely cover all of those cases.
The review should include application developers, DBAs, SREs or platform engineers, security reviewers, observability owners, and the product or application owner if alerts imply user impact.
This may sound heavy for a “small exporter.” It is not heavy for a component that connects to Oracle Database, queries database views, exposes database-derived metrics, and feeds alerting systems.
Start with the database identity
The first production decision is the database identity.
The exporter should use a dedicated monitoring identity where possible, not an application schema, personal account, DBA account, or shared administrative user.
That identity matters because the exporter is a database client. Every metric maps to some database query. The grants behind those queries define what database information can leave the database boundary. A dedicated identity simplifies access review, audit, rotation, revocation, and incident response.
Oracle’s exporter docs recommend connecting with the lowest possible privileges and roles necessary for the exporter to run. Oracle Database privilege and role behavior is covered in the Oracle Database Security Guide, and many default metrics query dynamic performance views documented in the Oracle Database Reference.
This is not unique to Oracle Database Metrics Exporter. Datadog, Dynatrace, New Relic, custom SQL jobs, and other Oracle Database monitoring paths also need a database identity, grants, credentials, and network reachability.
The safe question is not “Which tool avoids privileges?” The safe question is “Which metrics are approved, which objects do they require, and who reviews the grants?”
A dedicated identity has this general shape:
-- Pattern only. Do not run verbatim.-- Review syntax, container scope, password policy, account profile,-- common/local user requirements, and required object grants with your-- DBA/security process.---- CDB/PDB, RAC, Autonomous Database, and managed environments may differ.CREATE USER exporter_monitor IDENTIFIED BY "REPLACE_WITH_APPROVED_SECRET";GRANT CREATE SESSION TO exporter_monitor;-- Illustrative only: grant only views required by approved metrics.GRANT SELECT ON SYS.GV_$INSTANCE TO exporter_monitor;GRANT SELECT ON SYS.GV_$SESSION TO exporter_monitor;
This snippet is not a complete grant recipe. It shows the shape of a reviewed monitoring identity. The object list must come from the exact default metrics and custom metrics you approve for your topology.
Test grants using the same connection method and session role behavior the exporter uses. Do not assume a query succeeds for the monitoring user in SQL Developer, SQLcl, or an administrative session in exactly the same way it will succeed inside the exporter.
Oracle’s docs may list broad roles such as SELECT_CATALOG_ROLE as a way to make built-in metrics work. A broad role may be documented as a convenience path, but it is not automatically least privilege. Least privilege means reviewing the enabled metrics and granting only the required access where practical for your environment. If your organization allows SELECT_CATALOG_ROLE for operational reasons, document that as an explicit risk acceptance rather than describing it as least privilege.
Do not assume one grant recipe works for single-instance databases, CDB/PDB deployments, RAC, Autonomous Database, managed database services, and cloud-hosted databases. The topology matters.
Manage credentials and wallets as production secrets
After identity comes credential handling.
Treat exporter credentials with the same seriousness as application database credentials. The secret set may include the username, password, password files if supported by the deployed exporter version, Oracle Wallet or TCPS material where required, connect strings, service names, database endpoints, vault references, and tokens used by the deployment platform.
Kubernetes Secrets are a delivery mechanism, not a complete secret-management solution. They can be part of an approved path, but they do not answer rotation, access review, encryption, redaction, backup, or incident response by themselves. See the Kubernetes Secrets documentation for the platform behavior, then apply your organization’s secret-management policy.
Oracle’s 2.3.1 docs show environment-variable connection settings and a configuration-file model that includes fields such as passwordFile and tnsAdmin. Verify the exact field names, nesting, and supported credential methods for the image tag you deploy.
A conceptual configuration shape might look like this:
# Conceptual pattern only. Verify exact field names, nesting,# and supported credential methods against the current Oracle docs# and the exact image tag you deploy.databases: default: username: exporter_monitor passwordFile: /var/run/secrets/oracle-exporter/password url: dbhost.example.com:1521/appservice tnsAdmin: /var/run/secrets/oracle-wallet
The important point is not this exact YAML. The important point is the production habit: do not hard-code passwords in manifests or examples. Do not include real service names, tenant names, wallet paths, or connect descriptors in shared docs. Choose one supported credential path, document it, rotate it, and test exporter behavior during rotation.
If the database requires wallets or TCPS, review filesystem permissions, mount paths, renewal process, wallet distribution, wallet revocation, logging behavior, backup exposure, and incident response process.
If you use a vault integration, verify the exact syntax and support level for the deployed exporter version. Do not assume support for OCI Vault, Azure Key Vault, HashiCorp Vault, Secure External Password Store, or external authentication unless the current docs and your runtime test confirm it.
Also check logs. Exporter logs can be useful during connection failures, but logs may include service names, wallet paths, privilege errors, SQL errors, or other sensitive context. Redaction belongs in the production design, not only in the incident review.
Before sharing logs, screenshots, dashboard JSON, alert examples, or runbook excerpts outside the approved audience, review them for database names, service names, schema names, SQL text, tenant identifiers, wallet paths, hostnames, and internal network details.
Keep /metrics private
Once the exporter can connect to the database, protect the scrape endpoint.
The exporter endpoint should not be exposed as a public internet endpoint.
/metrics contains database-derived operational data. Labels may reveal system names, SQL identifiers, SQL text, schema names, service names, queue names, usernames, tenant identifiers, prompts, documents, workflow names, or application-specific values. Even if your initial metric set looks harmless, future default metrics, custom SQL metrics, or exporter upgrades can change what appears at the endpoint.
Prometheus’ model makes the endpoint powerful because scrapers can pull metrics directly. That same model makes endpoint exposure important. Prometheus documents the scrape configuration model in its configuration reference and explains metric labels in the data model.
The practical takeaway is simple: if a client can scrape the exporter, it can see what the exporter exposes before downstream relabeling, dropping, retention, or remote-write filtering.
A private Kubernetes ClusterIP Service is not, by itself, an access-control model. NetworkPolicy can help restrict access, but Kubernetes NetworkPolicy enforcement depends on the cluster networking implementation. Creating a NetworkPolicy in a cluster whose CNI does not enforce NetworkPolicy does not protect the endpoint. Also remember that NetworkPolicy is additive: pods are not isolated for ingress or egress until a policy selects them for that direction. Test enforcement from the Prometheus pod, from an unapproved pod in the same namespace, and from an unapproved pod in another namespace.
TLS and authentication through --web.config.file are version-sensitive and should be verified against the exporter’s current support for Prometheus exporter-toolkit-style web configuration. Do not assume TLS or authentication is enabled by default. Also treat TLS and authentication as policy decisions, not only feature checks: confirm whether your organization requires encrypted scrape traffic, authenticated scrapers, certificate rotation, service-mesh policy, or additional authorization controls for database-derived metrics.
Here is an ingress NetworkPolicy pattern that allows only an approved Prometheus pod to reach the exporter:
# Pattern only. Verify namespace labels, pod labels, port names,# and CNI NetworkPolicy enforcement in your cluster.# This is an L3/L4 control, not a replacement for TLS, authentication,# service mesh policy, RBAC, or data-governance review.apiVersion: networking.k8s.io/v1kind: NetworkPolicymetadata: name: allow-prometheus-to-oracle-exporter namespace: app-observabilityspec: podSelector: matchLabels: app: oracle-db-metrics-exporter policyTypes: - Ingress ingress: - from: - namespaceSelector: matchLabels: kubernetes.io/metadata.name: monitoring podSelector: matchLabels: app.kubernetes.io/name: prometheus ports: - protocol: TCP port: 9161
That pattern is useful only if the labels, namespaces, ports, and CNI enforcement match your cluster. It does not replace TLS, authentication, RBAC, service mesh policy, or data-governance review.
NetworkPolicy limits which pods can open a connection; it does not prove the client is an approved scraper identity at the application layer and does not encrypt the scrape payload.
Production review also includes the exporter’s outbound path to Oracle Database:
# Pattern only. RAC, SCAN listeners, Autonomous Database, private endpoints,# cloud gateways, service mesh, DNS behavior, and CNI behavior may require# a different model. DNS can require TCP/53 as well as UDP/53.apiVersion: networking.k8s.io/v1kind: NetworkPolicymetadata: name: restrict-oracle-exporter-egress namespace: app-observabilityspec: podSelector: matchLabels: app: oracle-db-metrics-exporter policyTypes: - Egress egress: - to: - ipBlock: cidr: 10.20.30.40/32 ports: - protocol: TCP port: 1521 - to: - namespaceSelector: matchLabels: kubernetes.io/metadata.name: kube-system ports: - protocol: UDP port: 53 - protocol: TCP port: 53
RAC, SCAN listeners, Autonomous Database, private endpoints, cloud gateways, DNS behavior, service mesh sidecars, and CNI-specific FQDN policy can require different designs. An egress policy that is too narrow can break database failover, wallet retrieval, or DNS. An egress policy that is too broad may fail the review.
For RAC, SCAN listeners, private endpoints, and managed database services, prefer a topology-specific tested egress design over a single hard-coded database IP if failover or endpoint rotation is part of the service behavior.
The right answer is topology-specific and tested.
Scrape deliberately with Prometheus or the OpenTelemetry Collector
After the endpoint is private, make the scrape path explicit.
Oracle Database Metrics Exporter exposes Prometheus-compatible metrics. Prometheus scrapes /metrics, stores time series, evaluates PromQL, and can run alert rules. The OpenTelemetry Collector can scrape Prometheus-format metrics through the Prometheus receiver and forward metrics through a Collector pipeline. Grafana visualizes metrics by querying Prometheus or another metrics backend.
Do not blur those roles. Grafana does not make the exporter safe. It makes reviewed metrics visible. The OpenTelemetry Collector can be part of the scrape-and-forward path, but do not claim the exporter natively pushes OTLP unless you verify that behavior for the exact exporter version.
A Prometheus scrape pattern should make interval and timeout deliberate:
# Pattern only. Verify service discovery, TLS, authentication,# relabeling, job labels, timeout, and interval for your environment.scrape_configs: - job_name: oracle-db-metrics-exporter scrape_interval: 30s scrape_timeout: 10s static_configs: - targets: - oracle-db-metrics-exporter.app-observability.svc.cluster.local:9161
Prometheus scrape syntax is documented in the Prometheus configuration reference. Static targets keep the example short; production may use Kubernetes service discovery, file service discovery, relabeling, TLS, authentication, or a service mesh.
If your platform standardizes on OpenTelemetry Collector, the Collector can own the scrape:
# Pattern only. Verify that your Collector distribution includes# the Prometheus receiver and that your backend accepts the resulting metrics.receivers: prometheus: config: scrape_configs: - job_name: oracle-db-metrics-exporter scrape_interval: 30s scrape_timeout: 10s static_configs: - targets: - oracle-db-metrics-exporter.app-observability.svc.cluster.local:9161processors: batch: {}exporters: otlp: endpoint: otel-gateway.observability.svc.cluster.local:4317 tls: # Set according to your gateway's actual TLS configuration. insecure: falseservice: pipelines: metrics: receivers: [prometheus] processors: [batch] exporters: [otlp]
The OpenTelemetry Collector configuration model is documented in the Collector docs, and the Prometheus receiver lives in the OpenTelemetry Collector Contrib project. Verify receiver availability in the Collector distribution you deploy.
Review scrape interval, scrape timeout, exporter query timeout if supported, and custom metric timeout together.
A short scrape interval can increase database query frequency. A long scrape interval can delay detection and reduce dashboard resolution. Multiple Prometheus servers or Collectors scraping the same exporter can multiply database work if the exporter collects on scrape rather than serving cached results. Verify the exporter’s collection behavior for your deployed version before adding HA scrapers, federation, or parallel Collector pipelines.
Decide which system owns scrape-health alerting before production rollout.
Review default metrics before enabling them broadly
Default metrics are useful because they give teams a starting point. They are still database queries and labels.
Before enabling them broadly, inspect the exact default metrics for the exporter tag you deploy. Use Oracle docs, release notes, and the repository as source anchors, but do not assume the repository main branch matches your deployed image. Compare the tagged default metrics file, the image contents if available, and live /metrics output from your environment.
For each enabled metric, record the metric name, metric type, database views or SQL behind it, required grants, exposed labels, expected cardinality, dashboard or alert usage, interpretation owner, and approval decision. Also record whether any label can contain sensitive identifiers. That review note does not need to be complex, but it should be explicit enough that a DBA, application owner, SRE, and security reviewer can understand what the exporter is allowed to expose.
For the live /metrics review, capture a sample from the same network path the scraper will use. Confirm the exporter build/version if exposed, the oracledb_up value if that metric is present, expected default metrics, expected custom metrics, unexpected labels, high-cardinality labels, sensitive label values, scrape duration or error self-metrics if present, and whether metric names match dashboard and alert queries.
Inspect oracledb_up, if present in your deployed version, because it tells you whether the database is reachable from the exporter’s point of view. Confirm the metric name in live /metrics before wiring dashboards or alerts.
Also inspect exporter self-metrics if they are present in your deployed version. Examples to look for may include scrape error, scrape duration, and scrape count metrics, but names and semantics must be confirmed from live /metrics for the exact image you deploy.
Those metrics help you distinguish database signals from exporter collection problems.
Then inspect session metrics, activity metrics, wait metrics, tablespace or resource metrics, and top SQL metrics if present in your deployed version. Labels such as sql_id and sql_text need special review. SQL IDs, SQL text, usernames, schemas, module names, service names, tenant identifiers, queue names, and workflow names may be sensitive depending on your environment.
Top SQL metrics are triage hints, not a tuning workflow. They can point responders toward the next question, but they do not replace AWR, ASH, SQL Monitor, execution-plan analysis, SQL Tuning Advisor, ADDM, Performance Hub, or DBA workflows.
Truncated SQL text is not automatically safe. A default metric is not automatically approved for every environment.
Metrics guide investigation. They do not prove root cause by themselves.
Add custom SQL only after review
Custom SQL metrics are powerful because they expose business-relevant database signals. They are risky because they can add query cost, sensitive labels, fragile SQL, new grants, and high-cardinality dimensions.
Good custom metric candidates answer bounded operational questions. A queue-depth metric by a small approved queue-name list can be useful. So can failed job counts by a bounded status list, stale workflow counts aggregated by workflow type, ingestion backlog by approved pipeline name, or RAG document indexing backlog aggregated by approved status categories.
Poor candidates are metrics that turn user, request, document, prompt, session, tenant, URL, file, exception, raw SQL text, or workflow-instance values into labels. Queries that scan large application tables every scrape are also poor candidates, even if they look harmless in development.
A bounded queue-depth metric might have this shape:
# Pattern only. Verify current custom metric format, field names,# column-name matching behavior, timeout behavior, and metric-name# generation against the exporter docs and the exact image tag you deploy.## Oracle SQL returns unquoted identifiers in uppercase metadata. Depending# on exporter behavior, you may need quoted aliases such as "queue_name"# and "depth", or you may need to use the uppercase names expected by the# exporter version you run.[[metric]]context = "app_queue"request = """SELECT queue_name AS "queue_name", COUNT(*) AS "depth"FROM app_work_queueWHERE status = 'READY'GROUP BY queue_name"""labels = ["queue_name"][metric.metricsdesc]depth = "Number of ready items in an approved application queue"
This example is intentionally small. It assumes queue_name is a short approved list, not a tenant ID, workflow ID, or arbitrary customer-provided value. It also assumes the query cost has been reviewed at production scale.
Before using a custom metric in production, test the exact query and exporter configuration together and confirm that the returned column names match the labels and metric descriptors expected by the exporter.
For application tables, review the execution plan, indexes, expected row counts, and concurrency impact at the chosen scrape interval. A custom metric that performs a full table scan every 30 seconds is production workload, not passive observation.
For each custom SQL metric, ask what operational question it answers, who will use it, which dashboard or alert consumes it, which grants it requires, how expensive it is at production scale, which scrape interval and timeout apply, what happens if it fails, whether labels are bounded, whether labels are safe to expose, and who owns the query when schema changes.
Custom SQL metrics are production code. They need owners, tests, review, disablement paths, and retirement criteria.
Control label cardinality before it controls your backend
Label cardinality is the number of distinct label values, or combinations of label values, a metric can produce. In Prometheus-style metrics, every unique combination of metric name and label values becomes a distinct time series.
That is useful when labels are bounded and meaningful. It becomes expensive and noisy when labels contain unbounded values such as user IDs, request IDs, document IDs, prompt IDs, session IDs, SQL text, or workflow instance IDs.
The Prometheus data model identifies each time series by metric name and label set. Changing label values, adding labels, or removing labels changes the resulting time series. The Prometheus configuration docs also warn that label dropping must preserve meaningful and unique series.
Dropping labels is not always safe; it can merge series and change the meaning of a metric.

Prefer bounded labels such as status, region, approved service name, queue name from a small approved list, wait class, or a small reviewed workflow type list.
Avoid unbounded labels such as user ID, request ID, document ID, session ID, prompt ID, URL, SQL text, workflow instance ID, exception text, or anything derived from arbitrary user or workload input.
Treat SQL text as sensitive by default. Treat sql_id as review-worthy because it can produce many series and may be correlated with query text elsewhere. Treat schema names, usernames, service names, tenant identifiers, prompt IDs, document IDs, queue names, and workflow IDs as exported data, not harmless metadata.
You can inspect exporter series and high-risk labels with scoped PromQL patterns:
count by (__name__) ({job="oracle-db-metrics-exporter"})
count by (__name__, sql_id) ({job="oracle-db-metrics-exporter", sql_id!=""})
count by (__name__, sql_text) ({job="oracle-db-metrics-exporter", sql_text!=""})
Use broad PromQL selectors carefully in large production backends. Scope by job, namespace, environment, database service, or another approved label so the inspection query itself does not become a problem.
Do not rely only on backend filtering. Prometheus relabeling, remote-write filtering, Collector processors, and backend retention policies can reduce downstream storage or visibility, but they do not protect the exporter endpoint itself.
If a label appears at /metrics, any approved scraper or accidental endpoint exposure can see it before downstream filtering.
Cardinality review belongs before rollout, not after storage costs rise, dashboard queries slow down, or alert labels leak sensitive identifiers.
Alert on failures that need action
Alerts should start with failures that require action, not with every interesting database signal.
Good first alert categories include Prometheus being unable to scrape the exporter, the exporter being reachable while oracledb_up reports database reachability failure if that metric is present, exporter scrape or collection errors if those self-metrics are present, scrape duration approaching the timeout budget if that self-metric is present, custom metric timeouts or failures if the exporter exposes that signal, missing required metrics, and cardinality spikes after a deployment or metric change.
Be cautious with raw database-performance alerts until you have baselines and ownership.
Prometheus alert rules are documented in the Prometheus alerting rules guide. The following example is a pattern, not a universal rule file.
Verify metric names, labels, thresholds, severity, and routing against your exporter version and alerting standards.
# Pattern only. Confirm these metric names and semantics in live /metrics# for your exact exporter version before enabling these rules.# The self-metric names shown here are examples to verify, not guarantees.groups: - name: oracle-db-metrics-exporter.rules rules: - alert: OracleDatabaseMetricsExporterTargetDown expr: up{job="oracle-db-metrics-exporter"} == 0 for: 5m labels: severity: warning annotations: summary: "Oracle Database Metrics Exporter target is down" description: "Prometheus cannot scrape the Oracle Database Metrics Exporter target." - alert: OracleDatabaseMetricsExporterDatabaseUnreachable expr: oracledb_up{job="oracle-db-metrics-exporter"} == 0 for: 5m labels: severity: critical annotations: summary: "Oracle Database is unreachable from the exporter" description: "The exporter is reachable, but its Oracle Database reachability check is failing." - alert: OracleDatabaseMetricsExporterDatabaseReachabilityMetricMissing expr: absent(oracledb_up{job="oracle-db-metrics-exporter"}) for: 10m labels: severity: warning annotations: summary: "Oracle Database reachability metric is missing" description: "The expected oracledb_up metric is absent. Check exporter version, scrape output, relabeling, and metrics pipeline configuration." - alert: OracleDatabaseMetricsExporterScrapeError expr: oracledb_exporter_last_scrape_error{job="oracle-db-metrics-exporter"} != 0 for: 10m labels: severity: warning annotations: summary: "Oracle Database Metrics Exporter reports scrape errors" description: "The exporter is reachable, but its last collection reported an error." - alert: OracleDatabaseMetricsExporterSlowScrape expr: oracledb_exporter_last_scrape_duration_seconds{job="oracle-db-metrics-exporter"} > 8 for: 10m labels: severity: warning annotations: summary: "Oracle Database Metrics Exporter scrape duration is high" description: "Exporter collection duration is approaching the expected scrape budget."
The up alert is Prometheus-side target health. The oracledb_up alert, if that metric exists with the expected semantics in your deployed version, is database reachability from the exporter’s point of view, not proof of application health or full database health.
Also decide how to handle missing expected metrics. An expression such as oracledb_up == 0 does not alert if the oracledb_up series is absent. If the metric is required for your production design, add a separate absent-series check or dashboard validation, and test it during exporter upgrades, relabeling changes, and Collector pipeline changes.
The scrape-error and scrape-duration examples require exporter self-metrics that must be confirmed in your deployed version. Tune thresholds to your scrape_timeout, exporter query timeout if supported, database topology, and approved custom metrics.
Avoid paging on raw waits, sessions, or top SQL without baselines. Prefer warnings, tickets, or investigation dashboards until the team understands normal workload patterns. Do not include sensitive label values in alert annotations.
Route exporter health alerts to the monitoring-chain owner. Route database reachability alerts according to the platform or DBA incident model. Route custom metric alerts to the team that owns the metric’s business meaning.
If Enterprise Manager, OCI Database Management, Datadog, Dynatrace, New Relic, Grafana, Prometheus, and cloud alarms all watch the same database, alert ownership matters more than alert volume. Choose which system pages humans, which system opens tickets, and which systems provide context only.
A duplicate page is not resilience. It is operational noise.
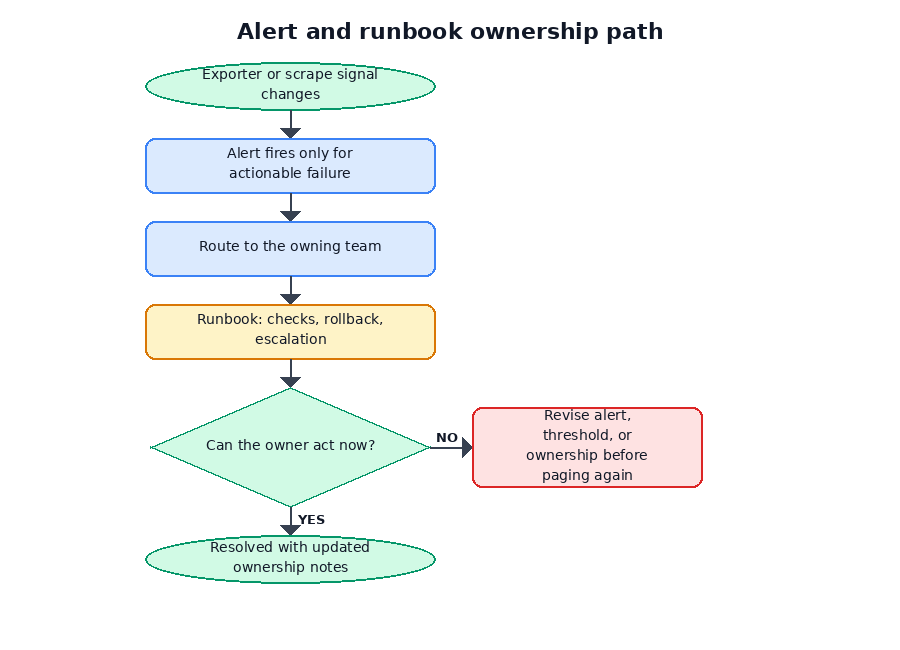
Write runbooks before alerts page someone
Every paging alert should have a runbook before it pages a human.
A useful runbook does not need to be long. It needs to tell responders what the alert means, what user impact is known or unknown, what to check first, what common causes exist, what mitigations are safe, when to escalate, and how to roll back or disable a broken component.
A runbook for database reachability from the exporter might look like this:
Runbook pattern:Alert: OracleDatabaseMetricsExporterDatabaseUnreachableMeaning: The exporter is reachable, but its Oracle Database reachability check is failing.Possible user impact: Unknown from this alert alone. Check application health and database service status.First checks: - Is the exporter target still up? - Did the database service, listener, wallet, DNS, route, or firewall change? - Did the exporter credential expire, rotate, or lock? - Is the database service reachable from the exporter network? - Do exporter logs show account lock, password, role, privilege, wallet, or service-name errors? - Did a CDB/PDB service name or Autonomous Database wallet change?Escalate to: DBA/platform owner for database service or credential issues. SRE/observability owner for exporter, scrape, or network path issues.Safe mitigations: - Roll back the last exporter configuration change if it caused the failure. - Restore the prior secret or wallet version if approved. - Disable a broken custom metric if it is blocking collection and the runbook allows it.Do not: - Share unredacted logs. - Add broad grants during incident response without approval. - Assume this alert proves application outage or database root cause.
For OracleDatabaseMetricsExporterTargetDown, first check whether the exporter pod or process is running, whether the Service or target address is correct, whether labels or service discovery changed, whether NetworkPolicy blocks Prometheus, whether TLS or authentication is misconfigured, whether the scrape timeout changed, and whether Prometheus can reach the endpoint from its own network.
For a database reachability alert such as oracledb_up == 0, first confirm that the metric exists and has the expected semantics for your exporter version. Then check whether the exporter itself is reachable, whether the database service, listener, wallet, DNS, route, or firewall changed, whether the credential expired or locked, whether the service is reachable from the exporter network, and whether exporter logs show account, role, privilege, wallet, or service-name errors.
For missing expected metrics, check the exporter version, live /metrics output, relabeling rules, Collector pipeline, backend ingestion, metric name changes, and dashboard or alert query assumptions.
For exporter scrape errors, identify which metric or query failed. Check grants, topology-specific views, custom SQL changes after schema migration, query timeouts, wallet paths, credential paths, and log redaction before sharing details.
For slow scrape duration, check whether custom metrics changed, whether scrape interval or timeout changed, whether a query scans more data after workload growth, whether the database is under load, whether multiple scrapers are hitting the same exporter, and whether the exporter is collecting too much per scrape.
For a cardinality spike, identify which metric name grew and which label drove the growth. Check recent custom metric deployments, default metric changes, exporter upgrades, and whether a label started carrying tenant, user, request, SQL text, document, prompt, or workflow identifiers.
Escalation should match the failure mode. Exporter process or scrape path issues belong with SRE, platform, or observability owners. Database reachability and grants belong with DBA or platform owners. Custom SQL metric failures belong with the application owner plus DBA review. Sensitive labels involve security and observability owners. Dashboard or alert query breakage belongs with the observability owner.
Build dashboards for decisions, not decoration
A production dashboard should help responders decide what to do next. It should not be a wall of raw database counters.
Grafana dashboards are documented in the Grafana dashboards docs, and Grafana can query Prometheus through the Prometheus data source. But Grafana is the dashboard and, in some organizations, the alerting surface. It does not make the exporter safe; it makes reviewed metrics visible.
A practical production dashboard should start with monitoring-chain health: Prometheus target status for the exporter, exporter scrape errors if exposed, and exporter scrape duration if exposed. Then it should show database reachability through oracledb_up if present in your deployed version and recent reachability transitions.
After that, add collection reliability and cost: last scrape error if exposed, scrape totals if exposed, collection duration versus scrape timeout if exposed, and custom metric failures or timeouts if exposed.
Only then should the dashboard move into workload context: sessions and activity indicators, wait categories with bounded labels, and top SQL or hotspot signals only if labels and audience are approved.
Application/database signals can follow: reviewed queue depth, ingestion backlog, workflow state counts, or RAG indexing backlog by approved status. Finally, add change overlays for application deployments, database changes, schema migrations, exporter upgrades, credential rotations, and network-policy changes.
The best panels answer operational questions:
- Is the monitoring path healthy?
- Is the database reachable from the exporter?
- Did collection cost change?
- Which bounded workload category changed?
- Where should we look next?
- Which recent deployment, schema migration, credential rotation, or network-policy change lines up with the signal?
Do not expose SQL text panels broadly. Do not put sensitive labels in public team dashboards. Use scoped variables to avoid massive PromQL fan-out. Review dashboard variables as carefully as panels. A variable query that lists sql_text, usernames, tenant identifiers, service names, or workflow IDs can expose sensitive values even if no panel displays them directly.
Document the intended audience for each dashboard.
A dashboard for DBAs can reasonably expose different details than a broad application team dashboard.
Top SQL or hotspot panels should be restricted or omitted unless SQL labels have been reviewed and the audience is appropriate. Use top SQL signals as hints for the next question, not as proof of root cause.
Assign operating ownership
If everyone can use the exporter but nobody owns it, the exporter becomes another production dependency with no accountable operator.
Ownership must be explicit before rollout. A short owner map is usually more valuable than a long architecture document.
Before rollout, name the team or person responsible for exporter deployment, exporter database identity, grant approval, default metric approval, custom SQL metric approval, Kubernetes Service, NetworkPolicy, secret delivery, Prometheus or Collector scrape configuration, alert routing, dashboard access, response when up == 0, response when database reachability fails from the exporter, exporter upgrade review, and emergency disablement of a broken custom metric.
A workable responsibility split often looks like this:
- Application developers propose application-specific custom metrics and explain their business meaning.
- DBAs review database identity, grants, query cost, topology, and database-specific interpretation.
- SREs or platform engineers own deployment, scrape path, alerting, runbooks, and reliability standards.
- Security reviewers review credentials, endpoint exposure, label sensitivity, retention, and access controls.
- Observability teams review metric naming, labels, cardinality, dashboards, retention, and remote write.
- Product or application owners define user impact and which alerts justify paging.
Shared responsibility is fine. Unowned responsibility is not. Ownership must include break/fix, upgrades, credential rotation, dashboards, alerts, and emergency disablement.
The emergency disablement point matters. A broken custom SQL metric can fail after a schema migration. A new label can create a cardinality spike. A credential rotation can break collection. Someone needs authority to disable, roll back, or restrict the exporter path safely while preserving the incident trail.
Review upgrades before changing the exporter
Treat an exporter upgrade like a monitoring schema change. It may not change application code, but it can change what your observability platform stores, alerts on, and exposes to users.
Before changing the exporter version, compare the old and new behavior:
Exporter upgrade review prompt:Before changing the exporter version, compare:- Release notes and changelog.- Image tag.- Runtime --help output.- Default metric files.- /metrics output before and after.- Added, removed, or renamed metrics.- Changed metric types.- Added, removed, or changed labels.- Cardinality impact.- Grants required by default metrics.- Custom metric behavior.- Wallet, password file, vault, and external-auth configuration.- --web.config.file behavior if TLS/auth is used.- Prometheus scrape success.- OpenTelemetry Collector scrape path, if used.- Dashboard queries.- Alert rules.- Rollback steps.- Approval owner.
Use the Oracle GitHub releases, repository, documentation, runtime --help, default metrics file, and live /metrics output for the exact image tag. Avoid unreviewed latest tags in production.
Metric names, labels, and types can change. New default metrics may require new grants. Removed or renamed metrics can break dashboards and alerts. Added labels can increase cardinality or expose sensitive data. Credential, wallet, password-file, vault, TLS, authentication, query timeout, and custom metric syntax can change.
Migration from an older or community exporter such as iamseth/oracledb_exporter is not “just swap the image.” Metric names, labels, grants, dashboards, alerts, and scrape behavior may differ.
Grafana Alloy’s prometheus.exporter.oracledb is an adjacent route for Grafana-centric teams, but it should be reviewed as its own exporter implementation and lifecycle. Do not assume it is identical to Oracle Database Metrics Exporter unless you verify the embedded implementation, metric set, labels, grants, wallet behavior, and upgrade path.
Use a production-readiness review before rollout
A deployment is ready for shared or production use only after the team can answer the production questions, not just after the endpoint returns metrics.
Use this review near the end of rollout planning:
Production-readiness review:A deployment is ready for shared or production use only after the team can answer:- Identity: Is the exporter using a dedicated monitoring identity?- Grants: Are grants approved for the exact default and custom metrics enabled?- Topology: Have CDB/PDB, RAC, Autonomous Database, managed database, or single-instance differences been reviewed?- Secrets: Are passwords, wallets, connect strings, and tokens delivered through approved secret paths?- Rotation: Has credential rotation been tested?- Endpoint: Is /metrics private?- Network: Can only approved scrapers reach the exporter?- TLS/auth: If required, is exporter endpoint TLS or authentication configured and tested?- Scrape config: Are interval, timeout, labels, and job names deliberate?- Default metrics: Has the team reviewed default metric names, labels, query cost, and grants?- Custom metrics: Is every custom SQL metric owned, reviewed, bounded, and useful?- Labels: Are sensitive and high-cardinality labels removed, aggregated, or restricted before rollout?- Prometheus/Collector: Is the scrape path clear and tested?- Alerts: Do alerts represent actionable failures?- Dashboards: Do dashboards support decisions and avoid exposing sensitive labels?- Runbooks: Does every paging alert have a runbook?- Retention: Are metrics retention and remote-write destinations approved?- Access: Are dashboard and metrics-backend permissions appropriate?- Ownership: Are deployment, grants, metrics, alerts, dashboards, and upgrades assigned to named teams?- Upgrade plan: Is there a version review and rollback process?- Rollback: Can a broken custom metric, scrape config, or exporter version be disabled quickly?
The expected result is a rollout decision:
- Approved for production.
- Approved with restrictions.
- Deferred pending grants review.
- Deferred pending label review.
- Deferred pending network controls.
- Deferred pending runbooks or ownership.
- Rejected until the design changes.
A checklist does not replace technical review. It makes the review concrete. If the team cannot name the identity, grants, scrape path, labels, alerts, dashboards, runbooks, owners, upgrade process, and rollback plan, the rollout is not ready.
The practical takeaway
A production exporter rollout is ready when the team can name the database identity, list the approved grants, protect the credentials, explain who can scrape /metrics, defend every high-risk label, show actionable alerts and dashboards, link to runbooks, identify owners, and describe how upgrades are reviewed.
That is the difference between a local demo and an operated production component.
The practical decision is not whether an exporter is “better” than a database management platform. The practical decision is which operating model your team can actually sustain. If your platform already runs Prometheus-compatible observability, Oracle Database Metrics Exporter can be a strong fit. If your DBA team already operates Enterprise Manager or OCI Database Management as the production control plane, use the exporter as a complementary signal or do not add it until ownership is clear.
Schedule the readiness review before broad rollout. Bring the exact exporter version, image tag, /metrics output, enabled metric list, custom SQL, grant list, scrape configuration, dashboard draft, alert rules, runbook links, retention plan, and owner map.
Do not roll out broadly until each trust boundary has an owner.

You must be logged in to post a comment.