
Key Takeaways
- OpenTelemetry tracing makes the Helidon AI request path inspectable without changing the assistant into a different application.
- Jaeger gives us a local trace viewer for the demo; the instrumentation is application-created spans around the work we care about.
- A stable recipe lookup is better than depending on a generated recipe id in a follow-on demo.
- The trace proves the instrumented path ran in order. It does not prove that every model answer is correct.
In the first article in this follow-on series, the Helidon Eats app learned how to answer a recipe question with OpenAI, LangChain4j, Oracle AI Database vector search, and the same recipe data from the published Helidon Eats demo. In the second article, the assistant gained a memory model: working memory in JSON, semantic memory in vectors, episodic memory as events, procedural memory as rules, and a SQL property graph to connect the user, ingredients, and recipes.
The code for this article is available in GitHub at https://github.com/markxnelson/helidon-eats/tree/AI3
That is enough behavior that a plain JSON response is no longer enough to explain what happened.
If the assistant says, “Try Tangy Rhubarb Salsa,” I want to know more than whether the final sentence sounds useful. Did the app embed the question? Did Oracle AI Database run the recipe vector search? Did the memory lookups run? Did the prompt get assembled after those lookups? Did LangChain4j call OpenAI chat? Which step took time?
That is what tracing is for.
Helidon SE can participate in OpenTelemetry, including configuration and APIs for tracing support, and the Helidon documentation describes its OpenTelemetry support as a preview feature in the Helidon 4.4.1 line Helidon OpenTelemetry docs. For this demo, I keep the instrumentation deliberately explicit. The application creates spans around the assistant path and exports them to Jaeger all-in-one over OTLP HTTP. Jaeger is the local viewer; the spans are created by our Helidon application.
Keep one repeatable request
Before adding tracing, I want a stable request path.
The request is the same one we have used throughout the demo:
GET /ask?q=what%20can%20I%20make%20with%20rhubarb
The answer should exercise the same pieces each time: question embedding, Oracle recipe vector search, working memory lookup, semantic memory vector search, procedural rule lookup, prompt build, and OpenAI chat.
There is a small but important database detail here. The recipe rows come from the already-published Helidon Eats article. The recipe ids are generated when the data is loaded. That means a hard-coded id is a poor anchor for a follow-on article. It may be correct in one validation database and wrong in another.
The demo now resolves the recipe from its stable content instead:
WITH target_recipe AS ( SELECT * FROM recipe WHERE recipe_title = 'Tangy Rhubarb Salsa' AND category = 'Appetizers And Snacks' AND subcategory = 'Salsa' FETCH FIRST 1 ROW ONLY)SELECT recipe_id, recipe_titleFROM target_recipe;
That gives the rest of the demo a durable anchor. The generated id can vary, but the title/category/subcategory row is the one the published data set is meant to contain. The smoke test checks that the row exists exactly where the follow-on demo expects it.
This matters for observability because traces are easier to compare when the domain path is stable. OpenAI can still phrase an answer differently. That is fine. The application path should still be the same.
Add Jaeger to the local stack
The Docker Compose file keeps Oracle AI Database and adds Jaeger all-in-one:
services: jaeger: image: jaegertracing/all-in-one:1.76.0 environment: COLLECTOR_OTLP_ENABLED: "true" ports: - "16686:16686" - "4318:4318" - "4317:4317" oracle: image: gvenzl/oracle-free:23.26.2-slim-faststart ports: - "15211:1521"
Jaeger documents the all-in-one image as a quick local way to run the collector and query UI together, with the UI on 16686 and OTLP ports on 4317 and 4318 Jaeger getting started. That gives us a local trace viewer that is easy to start beside the database container. It keeps setup small while still giving every span a place to land.
The application points the OpenTelemetry exporter at the HTTP endpoint:
OTEL_EXPORTER_OTLP_ENDPOINT=http://localhost:4318/v1/tracesOTEL_SERVICE_NAME=helidon-eats-ai
I am using OTLP HTTP here because it keeps the Java exporter configuration small. The Jaeger container also exposes the gRPC OTLP port if you prefer that path.
Create the tracer once
The app creates one small TracingSupport helper during startup. When OTEL_EXPORTER_OTLP_ENDPOINT is set, it builds an OpenTelemetry SDK tracer provider and an OTLP HTTP span exporter. When the variable is not set, it returns a no-op tracer.
OtlpHttpSpanExporter exporter = OtlpHttpSpanExporter.builder() .setEndpoint(config.otelEndpoint()) .build();SdkTracerProvider provider = SdkTracerProvider.builder() .setResource(resource) .addSpanProcessor(SimpleSpanProcessor.create(exporter)) .build();
For a tutorial app, SimpleSpanProcessor is easy to reason about. Each finished span is exported immediately. For a production service, I would usually use batching and a collector strategy, but that is not the point here.
The helper exposes two operations the rest of the app uses:
Span span(String name, SpanKind kind) { return tracer.spanBuilder(name) .setSpanKind(kind) .startSpan();}Span internalSpan(String name) { return span(name, SpanKind.INTERNAL);}
That is intentionally simplistic. The useful part is not the helper. The useful part is deciding which work units deserve spans.
Trace the assistant path
The top-level span is the Helidon route:
Span span = tracing.span("GET /ask", SpanKind.SERVER);span.setAttribute("http.route", "/ask");try (Scope ignored = span.makeCurrent()) { json(res, assistant.answer(question));} finally { span.end();}
Everything inside assistant.answer(question) becomes part of the same trace because the route span is current while the assistant runs.
Inside RecipeAssistant, the app creates a span for the overall answer:
Span answerSpan = tracing.internalSpan("assistant.answer");try (Scope ignored = answerSpan.makeCurrent()) { return tracedAnswer(question, answerSpan);} finally { answerSpan.end();}
Then the interesting work gets its own child spans:
openai.embedding.questionoracle.recipe.vector_searchoracle.memory.working_lookuporacle.memory.semantic_vector_searchoracle.memory.procedural_lookupassistant.prompt.buildopenai.chat.completion
This is the part that makes the trace readable. The spans are named for application work, not for implementation trivia. A reader can open the trace and follow the request path: embed the question, retrieve recipes, read memory, build the prompt, call OpenAI.
The Oracle vector search span records small, safe attributes:
span.setAttribute("db.system", "oracle");span.setAttribute("db.operation", "vector_search");span.setAttribute("recipe.search.limit", limit);span.setAttribute("recipe.hit.count", hits.size());span.setAttribute("recipe.first_hit.title", hits.getFirst().name());
That is enough to show that the vector search ran and returned Tangy Rhubarb Salsa as the first hit. It does not put the full recipe text in telemetry.
The OpenAI spans record the model and dimensions:
span.setAttribute("gen_ai.system", "openai");span.setAttribute("gen_ai.request.model", config.embeddingModel());span.setAttribute("embedding.vector.dimension", vector.length);
OpenTelemetry’s generative AI semantic conventions are useful, but they are marked as development, so I keep the mapping small and easy to change OpenTelemetry GenAI spans. I also avoid recording full prompts and full responses in spans. For this demo, counts, model names, selected recipe title, and memory hit counts are enough.
Bridge LangChain4j events into the trace
LangChain4j already gives us listener hooks for selected chat model implementations. The observability documentation describes ChatModelListener callbacks for request, response, and error events LangChain4j observability docs.
The demo keeps the existing listener, but now it also writes events onto the current OpenTelemetry span:
@Overridepublic void onRequest(ChatModelRequestContext context) { Span.current().addEvent("langchain4j.chat.request"); events.add(Instant.now() + " chat.request provider=" + context.modelProvider());}@Overridepublic void onResponse(ChatModelResponseContext context) { Span.current().addEvent("langchain4j.chat.response"); events.add(Instant.now() + " chat.response provider=" + context.modelProvider());}
This does not mean LangChain4j magically traces the whole application. It means the model listener gives the application a clean place to attach chat model events to the openai.chat.completion span.
That distinction is worth keeping. Observability is better when it is honest about the boundary. Helidon serves the route. The app creates spans around the AI work. LangChain4j gives model hooks. Oracle AI Database performs SQL lookups and vector search. OpenAI handles embedding and chat calls.
Run the traced request
Start the containers:
docker compose up -d oracle jaeger
The Oracle container mounts startup/ as /container-entrypoint-startdb.d, so the database setup runs on each container start. The startup script loads the predecessor Helidon Eats recipe data when the food.recipe table does not already contain the Tangy Rhubarb Salsa anchor, applies the additive AI schema, and runs the smoke checks.
docker compose exec oracle sqlplus -s food/Welcome12345##@FREEPDB1 @/work/sql/20-smoke-checks.sql
That smoke check should show one Tangy Rhubarb Salsa anchor, 500 recipe chunks, eight semantic memories, eight episodic events, four procedural rules, and the SQL property graph:
RECIPE_COUNT 1CHUNK_COUNT 500SEMANTIC_COUNT 8GRAPH_NAME EATS_MEMORY_GRAPH
Start the app with OpenAI and OTLP export:
export OPENAI_API_KEY=sk-your-keyexport OTEL_EXPORTER_OTLP_ENDPOINT=http://localhost:4318/v1/tracesexport OTEL_SERVICE_NAME=helidon-eats-aiSERVER_PORT=18080 mvn exec:java
The first startup pass embeds the missing recipe chunks and semantic memories. After that, ask the stable question:
curl "http://localhost:18080/ask?q=what%20can%20I%20make%20with%20rhubarb"
The answer can vary in wording, but the response should include the selected memory values and a recipe answer grounded in Tangy Rhubarb Salsa.
Then open Jaeger at:
http://localhost:16686
Search for the helidon-eats-ai service and open the GET /ask trace.
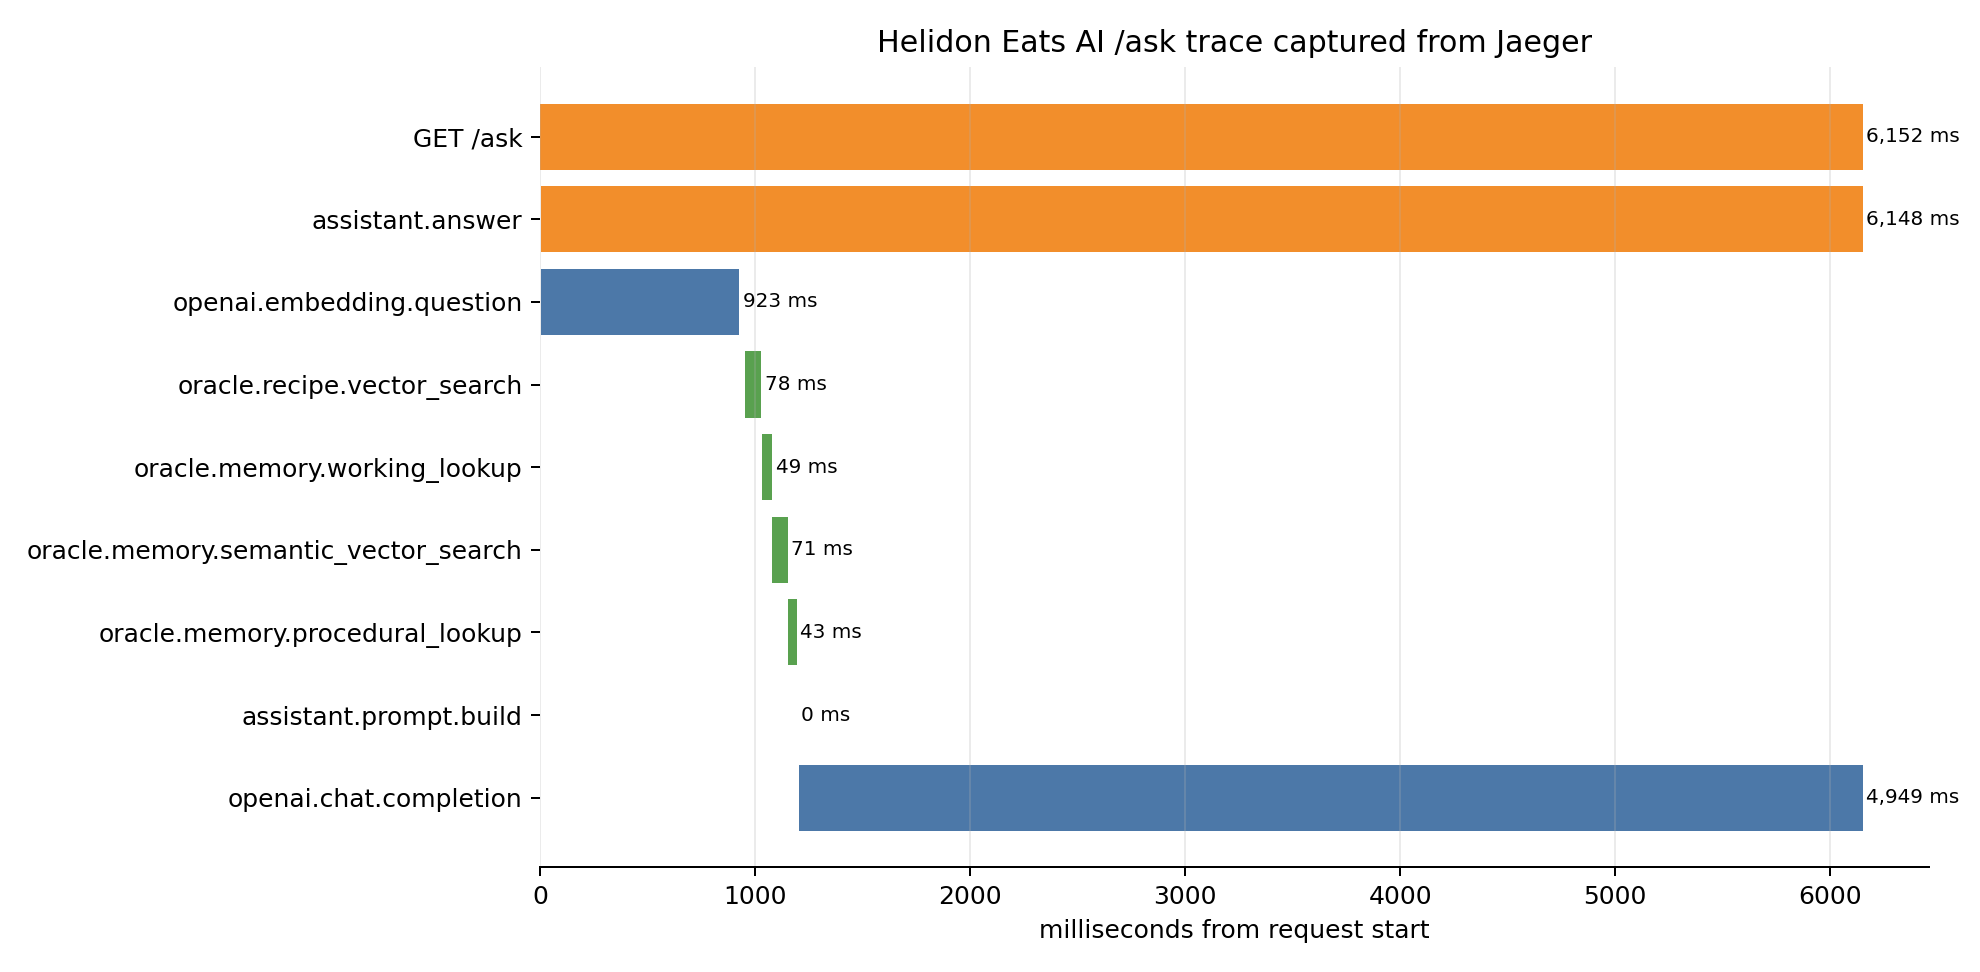
The trace summary above comes from the captured Jaeger trace. It shows the request-time path: the route span, the assistant span, the question embedding, Oracle vector search, three memory lookups, prompt build, and OpenAI chat call.
Read the trace as evidence
The trace answers a different question than the final JSON response.
The final response tells us what the assistant said. The trace tells us how the application got there.
In the captured request, the trace shows:
GET /ask assistant.answer openai.embedding.question oracle.recipe.vector_search oracle.memory.working_lookup oracle.memory.semantic_vector_search oracle.memory.procedural_lookup assistant.prompt.build openai.chat.completion
The Oracle vector span records two recipe hits and names Tangy Rhubarb Salsa as the first hit. The semantic memory span records one selected semantic memory. The working and procedural memory spans record that those values were present. The prompt-build span records the prompt length, not the prompt body. The OpenAI chat span records the model and response length, and it includes LangChain4j request and response events.
That is a useful level of evidence. It proves the instrumented path ran, in order, for that request. It proves the app did not skip memory retrieval before calling chat. It proves Oracle vector search ran before prompt assembly. It proves the model call happened after the grounded context was selected.
It does not prove the answer is always correct. It does not prove retrieval quality for every question. It does not prove anything about uninstrumented code. It does not give server-side timing inside OpenAI or Oracle. It gives application-side evidence for the spans we created.
That is still a big improvement over guessing.
Validate with the API too
The Jaeger UI is the nicest way to inspect the trace, but the API is useful for validation. A dashboard screenshot can show that a human saw the trace. A small API check can prove that the expected spans are present.
For the stable request, I like checking the service list first:
curl "http://localhost:16686/api/services"
The result should include:
{"data":["helidon-eats-ai"]}
Then query for the request operation:
curl "http://localhost:16686/api/traces?service=helidon-eats-ai&operation=GET%20%2Fask&limit=1"
That returns the trace data as JSON. The fields are a little verbose, but they are deterministic enough for a smoke check. The request trace should contain these operation names:
GET /askassistant.answeropenai.embedding.questionoracle.recipe.vector_searchoracle.memory.working_lookuporacle.memory.semantic_vector_searchoracle.memory.procedural_lookupassistant.prompt.buildopenai.chat.completion
That check is not glamorous, but it is a useful habit. It keeps the trace claim grounded. If the trace is missing oracle.memory.semantic_vector_search, then the request did not prove semantic-memory retrieval. If the trace is missing openai.chat.completion, then the app might have returned a setup response, failed before the model call, or hit a different path. The API check makes those cases visible.
It also separates two kinds of evidence.
The SQL smoke check proves the database state: 500 chunks, eight semantic memories, eight episodic events, four procedural rules, one working-memory row, and a graph edge from Tangy Rhubarb Salsa to rhubarb.
The /ask response proves the live route can call OpenAI and return an answer with selected memory.
The Jaeger trace proves the instrumented request path: embedding, vector search, memory lookup, prompt build, and chat completion.
Each one catches a different class of mistake.
Together, they make the demo much easier to trust.
Those are three different checks, and I want all three. When a demo combines AI, database retrieval, and memory, a single “it returned JSON” check is too thin.
Choose attributes carefully
Span attributes are where observability can become either very helpful or very messy.
The recipe vector search span records recipe.hit.count and recipe.first_hit.title. That is enough to confirm that the query returned two chunks and that the first one was Tangy Rhubarb Salsa. It does not record the entire chunk text. The semantic memory span records memory.semantic.hit.count, not the full memory document. The prompt-build span records prompt.length, not the prompt body.
Those choices are deliberate.
The most useful attributes are the ones that explain application decisions without turning telemetry into another data store. If the assistant starts returning odd answers, recipe.hit.count=0 is a strong clue. If memory.working.present=false, the request did not have the planning goal we expected. If prompt.length suddenly jumps from a couple thousand characters to tens of thousands, the prompt builder probably started including too much context.
Those are debugging signals. They are not secrets, and they are not the whole user conversation.
The same idea applies to the OpenAI spans. Recording gen_ai.system=openai, gen_ai.request.model=gpt-4o-mini, and embedding.vector.dimension=1536 is useful. Recording the API key would be a disaster. Recording the full prompt might be acceptable only in a local experiment with deliberate redaction. The default demo does not do that.
This is also why I prefer application-created spans for the teaching version. Automatic instrumentation is valuable, but explicit spans force us to name the application decisions we care about. For this assistant, those decisions are not hidden in the network stack. They are the recipe retrieval, memory selection, prompt construction, and model call.
Keep the trace useful
The most tempting mistake is to turn tracing into another place to dump everything. That usually makes traces noisier and less useful.
For this assistant, I would keep the default telemetry small:
- model name
- vector dimension
- recipe hit count
- first recipe title
- semantic memory hit count
- prompt length
- response length
- route name
- tenant/session identifiers that are safe for the demo
I would not put API keys, full prompts, full recipe context, or complete model responses into spans. If a team needs prompt capture for a local experiment, make it explicit, temporary, and redacted.
The stable recipe lookup also remains useful as the assistant grows. If you change the retrieval limit, memory filter, prompt template, or model, run the same rhubarb request and compare the trace. The exact answer text may move around, but the application path should still be understandable.
That gives us a nice close to this part of the series.
Article 1 grounded the assistant in Oracle AI Database vector search. Article 2 gave it memory. Article 3 makes the request path visible. The assistant is still small, but it now has the pieces I want before adding more ambitious agent behavior: trusted data, useful memory, and a trace that shows how the answer was assembled.

You must be logged in to post a comment.